Picking from the multitude of style mutual funds is a daunting task. In any given style there may be as many as 949 different mutual funds, and there are at least 6,260 mutual funds across all styles.
Why are there so many mutual funds? The answer is because mutual fund providers are making lots of money selling them. The number of mutual funds has little to do with serving investors’ best interests. Below are three red flags investors can use to avoid the worst mutual funds:
- Inadequate liquidity
- High fees
- Poor quality holdings
I address these red flags in order of difficulty. More details on the best & worst mutual funds by style are here.
How To Avoid Mutual Funds with Inadequate Liquidity
This is the easiest issue to avoid, and my advice is simple. Avoid all mutual funds with less than $100 million in assets. Low asset levels tend to mean lower volume in the mutual fund and larger bid-ask spreads.
How To Avoid High Fees
Mutual funds should be cheap, but not all of them are.
To ensure you are paying at or below average fees, invest only in mutual funds with total annual costs (TAC) below 2.08%, which is the average TAC of the 6,883 U.S. equity mutual funds I cover. If you weight the TACs by assets under management, then the average TAC is lower at 1.38%. A lower weighted average is a good sign that investors are putting money in the cheaper mutual funds.
Figure 1 shows the most and least expensive style mutual funds in the U.S. equity universe based on total annual costs. Rydex provides two of the most expensive style funds, while Vanguard provides four of the five cheapest Mutual Funds.
Figure 1: 5 Least and Most Expensive Style Mutual Funds
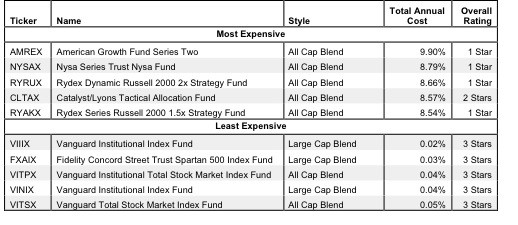 Sources: New Constructs, LLC and company filings
While costs among ETFs fall into a generally narrow range, mutual fund costs are more varied. The high costs of the most expensive mutual funds, sometimes above 9% annually, make it much harder for them to perform as well as the cheapest mutual funds.
However, investors need not pay high fees for good holdings. Sun America Focused Dividend Strategy Portfolio (FDSWX) is my number-one-rated style mutual fund overall, yet it has a low total annual cost of 0.92%.
On the other hand, the Vanguard Index Funds (VIIIX, VITPX, VINIX, VITSX) and the Fidelity Spartan 500 Index Fund (FXAIX) that make up the five cheapest funds in figure 1 all hold too many poor stocks, each getting a 3-star or Neutral rating. And no matter how cheap a mutual fund, if it holds bad stocks, its performance will be bad.
This result highlights why investors should not choose mutual funds based only on price. The quality of holdings matters more than price.
How To Avoid Mutual Funds with the Worst Holdings
This step is by far the hardest, but it is also the most important because a mutual fund’s performance is determined more by its holdings than its costs. Figure 2 shows the mutual funds within each style with the worst holdings or portfolio management ratings. The styles are listed in descending order by overall rating as detailed in my 4Q13 Style Rankings report.
Figure 2: Style Mutual Funds with the Worst Holdings
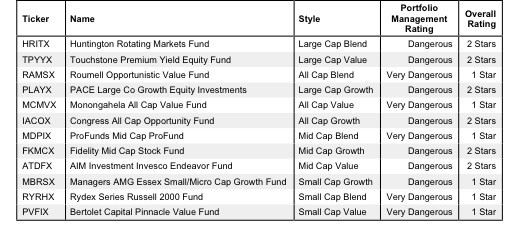
Sources: New Constructs, LLC and company filings
My overall ratings on mutual funds are based primarily on my stock ratings of their holdings. My firm covers over 3000 stocks and is known for the due diligence done on each stock we cover.
No one provider has more than a single fund in Figure 2. Half of the funds receive Very Dangerous ratings overall while the other half receive Dangerous ratings.
Note that no mutual funds with a Dangerous portfolio management rating earn an overall rating better than two stars. These scores are consistent with my belief that the quality of a mutual fund is more about its holdings than its costs. If the mutual fund’s holdings are Dangerous, then the overall rating cannot be better than Dangerous because one cannot expect the performance of the fund to be any better than the performance of its holdings.
While the Managers AMG Essex Small/Micro Cap Growth Fund (MBRSX) receives a Dangerous portfolio rating, its high annual costs of 2.36% lower its overall rating to Very Dangerous or 1-star. Even mutual funds with more highly rated holdings must be considered Dangerous or Very Dangerous if their costs are too great.
Find the mutual funds with the worst overall ratings on my mutual fund screener. More analysis of the Best Style mutual funds is here.
The Danger Within
Buying a mutual fund without analyzing its holdings is like buying a stock without analyzing its business and finances. As Barron’s says, investors should know the Danger Within. Put another way, research on mutual fund holdings is necessary due diligence because a mutual fund’s performance is only as good as its holdings’ performance.
PERFORMANCE OF MUTUAL FUND’s HOLDINGs = PERFORMANCE OF MUTUAL FUND
Best & Worst Stocks In These Mutual Funds
Tetra Technologies (TTI) is one of my least favorite stocks held by Roumell Opportunistic Value Fund (RAMSX) and earns my Dangerous rating. TTI’s profits (NOPAT) have fallen from $111 million in 2006 to $35 million in 2012. TTI’s return on invested capital (ROIC) is just 3%, which puts it in the bottom quintile of all companies I cover. The firm had a free cash flow (FCF) yield of -20% last year. One would think investors would shy away from a firm that has shown this kind of long-term profit decline and low returns on its capital, but the market has placed high expectations on TTI, currently trading at ~$13/share. To justify this stock price, the company must grow NOPAT by over 16% compounded annually for the next 17 years. This bad seems too risky for a firm that has seen profits decline over the last 7 years. TTI’s valuation is out of touch with the fundamentals of its business. Significant allocations to Dangerous-rated stocks like TTI result in RAMSX’s Very Dangerous portfolio management rating and Very Dangerous Overall Rating.
Chevron (CVX) is one of favorite holdings in the Vanguard Institutional Index Fund (VIIIX) and gets my Attractive rating. Chevron has grown profits (NOPAT) by an impressive 23% compounded annually since 1998 and has raised its return on invested capital (ROIC) from 4% to 11% over the same timeframe. Although these numbers show Chevron has strengthened its fundamentals and has the capability to grow profits dramatically, CVX, at ~$121/share, trades at an unduly cheap valuation. This valuation gives CVX a price to economic book value ratio of 0.8, implying that the market expects Chevron’s profits to permanently decline by 20%. With Chevron’s record of notable long-term profit growth and making effective use of its capital, a permanent 20% decline in the company’s NOPAT seems unlikely. VIIIX’s allocation to Attractive stocks like CVX earn it the best rating of the funds in figure 1.
André Rouillard and Jared Melnyk contributed to this article
Disclosure: David Trainer owns CVX. David Trainer, André Rouillard and Jared Melnyk receive no compensation to write about any specific stock, sector, or theme.