
Check out this week’s Danger Zone interview with Chuck Jaffe of Money Life.
Meridian Contrarian Fund (MFCAX, MFCCX, MFCIX, MVALX) is an All Cap Blend funds investors should avoid. The fund’s poor holdings[1] and high fees diminish the likelihood that the fund will outperform moving forward. Meridian Contrarian Fund (MFCAX) is in the Danger Zone this week.
Traditional Fund Research Misses this Fund’s Flaws
Per Figure 1, MFCAX receives a 4-Star rating from Morningstar and the remaining classes receive a 3 or 4-Star rating as well. When viewed through our Predictive Risk/Reward Fund Rating methodology, all four classes earn an Unattractive-or-worse rating, with MFCAX earning a Very Unattractive rating.
Figure 1: Meridian Contrarian Fund Ratings

Sources: New Constructs, LLC and company filings
Holdings Quality Analysis Reveals Poor Allocation vs. Benchmark
The only justification for a mutual fund to charge higher fees than its ETF benchmark is “active” management that leads to out-performance. A fund is most likely to outperform if it has higher quality holdings than its benchmark. To make this determination on holdings quality, we leverage our Robo-Analyst technology to drill down and analyze the individual stocks in every fund we cover.
Figure 2: Meridian Contrarian Fund (MFCAX) Asset Allocation
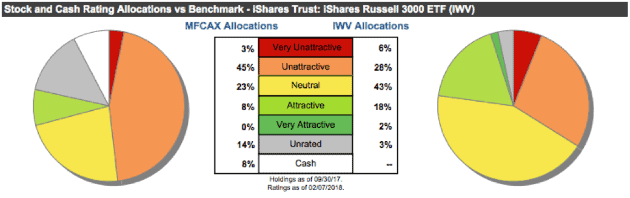
Sources: New Constructs, LLC and company filings
Per Figure 2, Meridian Contrarian Fund’s asset allocation increases downside risk compared to its benchmark, iShares Russell 3000 (IWV). MFCAX allocates only 8% of its portfolio to Attractive-or-better rated stocks compared to 20% for IWV. Exposure to Very Unattractive rated stocks is much higher for MFCAX (48% of portfolio) than for IWV (34% of portfolio). Overall, MFCAX allocates 31% of its portfolio to stocks with a Neutral-or-better rating while IWV allocates 63% of its portfolio to Neutral-or-better rated stocks.
Seven of the mutual fund’s top 10 holdings receive an Unattractive rating and make up 21% of its portfolio. One of the top 10 holdings is previous Danger Zone pick Verint Systems (VRNT). In total, nine of the top 10 receive a Neutral-or-worse rating and make up 27% of MFCAX’s portfolio.
Given the unfavorable distribution of Attractive vs. Very Unattractive allocations relative to the benchmark, Meridian Contrarian Fund appears poorly positioned to generate the outperformance required to justify its fees.
MFCAX Allocates to Overvalued Stocks
Figure 3 contains our detailed rating for MFCAX, which includes each of the criteria we use to rate all funds under coverage and shows the fund’s poor portfolio management. These criteria are the same for our Stock Rating Methodology, because the performance of a fund’s holdings equals the performance of a fund after fees.
Figure 3: Meridian Contrarian Fund (MFCAX) Rating Breakdown
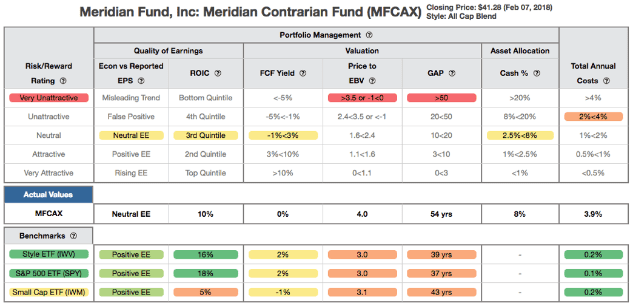
Sources: New Constructs, LLC and company filings
The return on invested capital (ROIC) for MFCAX’s holdings is 10%, which is below the 16% ROIC earned by companies held by IWV and the 18% earned by S&P 500 companies. Further, the 0% free cash flow (FCF) yield of MFCAX’s holdings is below IWV and the S&P 500 (2%). These numbers are remarkable when one considers that “improving return on invested capital and free cash flow” is one of the stated criteria MFCAX uses when selecting stocks.
At the very least, one might expect the stocks held by a contrarian fund to be cheaper than the market, but that’s not the case either. The price to economic book value (PEBV) ratio for IWV is 3.0, while the PEBV ratio for MFCAX is 4.0. The companies held by MFCAX earn inferior cash flows and are valued at a premium to those cash flows when compared to the benchmark.
Lastly, our discounted cash flow analysis of fund holdings reveals a market implied growth appreciation period (GAP) of 54 years for MFCAX compared to 39 years for IWV. In other words, MFCAX companies have to grow economic earnings for 15 years longer than companies held by IWV to justify their current stock prices. This expectation seems even more unlikely given that MFCAX’s holdings are less profitable than IWV, as measured by ROIC.
Verint Systems (VRNT) is one of MFCAX’s top holdings, earns an Unattractive rating, and was a Danger Zone pick in April 2017. Since publish VRNT is down 10% while the S&P 500 is up 12%. VRNT’s after-tax profit (NOPAT) fell 33% compounded annually since 2014 while its ROIC fell from 10% in 2014 to 2% TTM. Despite the fundamental issues, VRNT is still up 25% over the past two years and shares remain overvalued.
To justify its current price of $39/share, VRNT must achieve 6% margins (vs 4% TTM) and grow NOPAT by 19% compounded annually for the next 11 years. This scenario seems unlikely given VRNT’s inability to grow NOPAT since 2014. Even if we assume VRNT can achieve a 6% NOPAT margin and grow NOPAT by 15% compounded annually for the next decade, the stock is worth only $21/share today – a 46% downside.
Excessive Fees Make the Fund More Risky
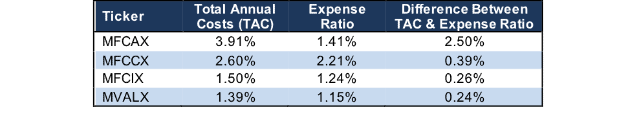
At 3.91%, MFCAX’s total annual costs (TAC) are higher than 96% of All Cap Blend style funds and all funds under coverage. For comparison, the average TAC of all All Cap Blend mutual funds under coverage is 1.81%, the weighted average is 0.51%, and the benchmark ETF (IWV) has total annual costs of 0.20%. Per Figure 4, Meridian Contrarian Fund’s expense ratios understate the true costs of investing in this fund. Our TAC metric accounts for more than just expense ratios. We take into account the impact of front-end loads, back-end loads, redemption fees, and transaction costs.
Figure 4: Meridian Contrarian Fund’s Cost Comparison
Sources: New Constructs, LLC and company filings
To justify its higher fees, each class of the fund must outperform its benchmark by the following over three years:
- MFCAX must outperform by an average of 3.69% annually.
- MFCCX must outperform by an average of 2.38% annually.
- MFCIX must outperform by an average of 1.27% annually.
- MVALX must outperform by an average of 1.17% annually.
An in-depth analysis of MFCAX’s TAC is on page 2 here.
Short-Term Outperformance Looks Unlikely to Continue
Over the past three years, MFCAX has not surpassed the 3.69% per year outperformance required to justify its higher fees, in terms of growth in $10K invested. Growth of $10K is not load adjusted, so, while it may seem on the surface as if MFCAX has outperformed net of fees, it has not once all costs are accounted for. For reference, MFCAX’s load adds 2.19% to its total annual costs. MFCAX’s performance looks worse when moving beyond the 3-year timeframe. Per Figure 5, MFCAX has underperformed (measured by growth of $10K) its benchmark over the past five and ten-year periods compounded annually.
Figure 5: MFCAX vs. IWV: Growth of 10K Over Time

Sources: New Constructs, LLC and company filings.
Given that 48% of assets are allocated to stocks with Unattractive-or-worse ratings, MFCAX looks likely to underperform moving forward.
The Importance of Holdings Based Fund Analysis
The analysis above shows that while the All Cap Blend style receives an Attractive rating in our 1Q18 Style Ratings for ETFs & Mutual Funds report, it still contains risky funds. With so many ETFs and mutual funds in the style (855), picking the right one can be difficult. Smart fund investing means analyzing the holdings of each fund, which is impossible for the average investor to perform.
Our machine learning and AI Robo-Analyst technology helps investors navigate this investment style by sifting through the holdings of all 855 All Cap Blend ETFs and mutual funds. This diligence allows us to identify potentially dangerous funds that traditional backward-looking fund research may overlook.
Each quarter we rank the 11 sectors in our Sector Ratings for ETF & Mutual Funds and the 12 investment styles in our Style Ratings For ETFs & Mutual Funds report. This analysis allows us to find funds that investors using traditional fund research may view as quality investments while deeper analysis reveals otherwise, such as Meridian Contrarian Fund. Rather than putting money into MFCAX, investors would be better suited with one of the 437 Attractive-or-better rated ETFs and mutual funds in the All Cap Blend style.
This article originally published on February 12, 2018.
Disclosure: David Trainer and Kyle Guske II receive no compensation to write about any specific stock, sector, style, or theme.
Follow us on Twitter, Facebook, LinkedIn, and StockTwits for real-time alerts on all our research.
[1] Ernst & Young’s recent white paper, “Getting ROIC Right”, proves the superiority of our research and analytics.
Click here to download a PDF of this report.