Last week, analysts parsed 406 filings and collected 39,443 data points. In total, they made 6,642 accounting adjustments with a dollar value of $1.6 trillion.
Last week, analysts parsed 501 filings and collected 55,615 data points. In total, they made 9,915 accounting adjustments with a dollar value of $2.9 trillion.
Last week, analysts parsed 475 filings and collected 55,687 data points. In total, they made 11,756 accounting adjustments with a dollar value of $7.7 trillion.
Last week, analysts parsed 303 filings and collected 34,774 data points. In total, they made 6,193 accounting adjustments with a dollar value of $4.3 trillion.
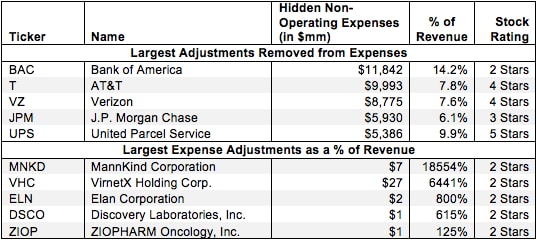
Non-operating expenses are unusual charges that don’t appear on the income statement because they are bundled in other line items. Without careful footnotes research, investors would never know that these non-recurring expenses distort GAAP numbers by lowering operating earnings.
Most investors are not aware that companies hide one-time and unusual charges and income inside normal, operating line items (e.g. “Cost of sales”) on their income statement. These hidden items can mislead investors by artificially decreasing/increasing GAAP earnings. We found 13,000+ one-time items buried in normal line items like “Cost of Sales” by studying the Footnotes of 10-K filings from 1998 thru 2/15/2011. This research revealed that companies have concealed over $41 billion in one-time items.