Fund holdings affect fund performance more than fees or past performance. A cheap fund is not necessarily a good fund. A fund that has done well in the past is not likely to do well in the future (e.g. 5-star kiss of death and active management has long history of underperformance). Yet, traditional fund research focuses only on low fees and past performance.
Our research on holdings enables investors to find funds with high quality holdings – AND – low fees.
Investors are good at picking cheap funds. We want them to be better at picking funds with good stocks. Both are required to maximize success.
Figure 1 shows that 60% of fund assets are in ETFs and mutual funds with low costs but only 5% of assets are in ETFs and mutual funds with Attractive holdings. This discrepancy is astounding.
Figure 1: Allocation of Fund Assets By Holdings Quality and By Costs
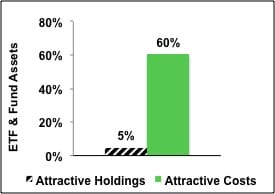 Source: New Constructs, LLC and company filings
Two key shortcomings in the ETF and mutual fund industry cause this large discrepancy:
- A lack of research into the quality of holdings.
- Not enough research focuses on the quality of Portfolio Management of funds
- A lack of high-quality holdings or good stocks.
- With about twice as many funds as stocks in the market, there simply are not enough good stocks to fill all the funds.
These issues are related, in my opinion. If investors had more insight into the quality of funds’ holdings, I think they would allocate a lot less money to funds with poor quality holdings.
Investors deserve research on the quality of stocks held by ETFs and mutual funds.
Quality of holdings is the single most important factor in determining an ETF or mutual fund’s future performance. No matter how low the costs, if the ETF or mutual fund holds bad stocks, performance will be poor. Costs are easy to find but research on the quality of holdings is almost non-existent.
Figure 2 shows investors are not putting enough money into ETFs and mutual funds with high-quality holdings. Only 393 of 7182 (5% of assets) of ETFs and mutual funds allocate a significant amount of value to quality holdings. 95% of assets are in funds that do not justify their costs and over charge investors for poor portfolio management.
Figure 2: Distribution of ETFs & Mutual Funds (Count & Assets) By Portfolio Management Rating
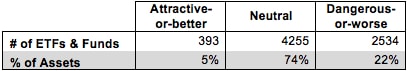 Source: New Constructs, LLC and company filings
Figure 3 shows that investors successfully identify low-cost funds. 60% of assets are held in ETFs and mutual funds that have Attractive-or-better rated Total Annual Costs, my apples-to-apples measure of the all-in cost of investing in any given fund.
Out of the 7187 ETFs and mutual funds I cover, 1,302 earn an Attractive-or-better Total Annual Costs rating.
Clearly, ETF and mutual funds investors are smart shoppers when it comes to finding cheap investments. But cheap is not necessarily good.
PRIMECAP Odyssey Funds: PRIMECAP Odyssey Aggressive Growth Fund (POAGX) is a great example of a fund with low costs but poor holdings. Its total annual costs are Attractive at only 0.88%. However, it still gets an overall predictive rating of Very Dangerous because no matter how low its fees, I expect it to underperform because it allocates over 53% of its assets to Dangerous-or-worse rated stocks. It also holds over 8% of its assets in cash. Investors should not be paying fees, no matter how low, for a fund to simply hold their cash for them. Low fees cannot boost fund performance. Only good stocks can boost performance.
Boulder Brands (BDBD) is one of my least favorite stocks held by POAGX and gets my Dangerous rating. Its economic earnings are negative and declining, driven by its low return on invested capital (ROIC), which declined from 3% to 2.5% in 2012. Along with its low ROIC, BDBD’s $133 million in asset write-downs (over 23% of net assets) is a sign of management failure to identify good investments. Add in BDBD’s significant debt, employee stock option liability, and deferred tax liability ($307 million combined, 53% of net assets) and BDBD’s financial situation starts to look rather shaky.
Instead of reflecting these poor fundamentals, however, BDBD stock is priced for significant growth. To justify its current valuation of ~$9.61/share, BDBD would need to grow after-tax profit (NOPAT) by 18% compounded annually for 16 years. BDBD’s valuation is telling a very different story than its income statement and balance sheet.
Heavy allocation to BDBD helps to explain why POAGX earns its Very Dangerous rating despite having such low costs.
Figure 3: Distribution of ETFs & Mutual Funds (Count & Assets) By Total Annual Costs Ratings
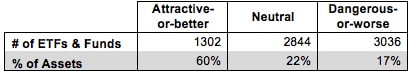 Source: New Constructs, LLC and company filings
Investors should allocate their capital to funds with both high-quality holdings and low costs because those are the funds that offer investors the best performance potential.
But they do not. Not even close.
Figure 4 shows that 3% of ETF and mutual fund assets are allocated to funds with low costs and high-quality holdings according to my Predictive Fund Ratings, which are based on the quality of holdings and the all-in costs to investors.
Note the fund industry offers 3,206 Dangerous-or-worse ETFs and mutual funds compared to just 158 Attractive-or-better ETFs and mutual funds, over 20 times more bad funds than good funds. That means a lot of fees are being paid to managers that do not deserve them.
Figure 4: Distribution of ETFs & Mutual Funds (Count & Assets) By Predictive Ratings
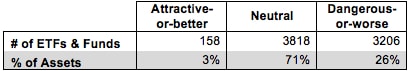 Source: New Constructs, LLC, and company filings
Investors deserve forward-looking ETF and mutual fund research that assesses both costs and quality of holdings. For example, Vanguard Consumer Staples ETF (VDC) has Attractive total annual costs of only 0.15% and allocates over 60% of its assets to Attractive-or-better rated stocks. This fund is proof that investors can have their cake and eat it too.
The Proctor & Gamble Company (PG) is one of my favorite stocks held by VDC and earns my Attractive rating. PG has an impressive track record of consistency, growing its after-tax profit (NOPAT) by 9% compounded annually over the past 14 years. Normally, I warn investors about companies whose reported earnings are rising while economic earnings decline, but in PG’s case the reverse is true. Over $1.2 billion in non-operating items hidden in the operating expenses caused PG’s GAAP net income to decline by over $1 billion while its NOPAT and economic earnings actually increased slightly.
PG’s misleadingly low reported income contributes to it being valued fairly cheaply by the market. At its current valuation of ~$78.59/share, PG has a price to economic book value ratio of only 1.1. This low valuation implies that the market expects PG’s NOPAT to grow from its current level by no more than 10% for the remainder of its corporate life. Given that PG has averaged annual NOPAT growth of almost 10% for 14 years, investors should feel confident that PG can exceed the modest expectations the market has set for it.
VDC’s 11% allocation to PG helps to drive its Attractive rating.
Anyone can look at the stocks held by funds, so why are most popular fund rating systems based on backward-looking past performance?
I do not know, but I do know that the lack of transparency into the quality of portfolio management provides cover for the ETF and mutual fund industry to continue to over charge investors for poor portfolio management. How else could they get away with selling nearly 20 times more Dangerous-or-worse ETFs and mutual funds than Attractive-or-better?
John Bogle is correct – investors should not pay high fees for active portfolio management. His index funds have provided investors with many low-cost alternatives to actively managed funds.
However, by focusing entirely on costs, he overlooks the primary driver of fund performance: the stocks held by funds.
Research on the quality of portfolio management of funds empower empowers investors to make better investment decisions. Investors should no longer pay for poor portfolio management.
Sam McBride contributed to this report.
Disclosure: David Trainer and Sam McBride receive no compensation to write about any specific stock, sector or theme.