Fake News and the Impact on Your Portfolio
We see so much fake news these days that it's hard to know what is real. The same is true of stock research. So much of it is designed to make the research producers (analysts and investment banks) money, not the readers. Wall Street might be the OG of fake news. Haha. You deserve better, and I am going to show you how to get it.
In this letter, I am going to show you clear examples of how misleading Wall Street and other research can be. I’m also going to show you how opaque their research is. Then, I am going to show you how our research is better and throw in a few free stock ratings. Now, you may be asking yourself, why do I keep giving away so much valuable information in these letters? The answers:
-
- We genuinely believe in improving the integrity of the capital markets.
- We hope to get your business one day.
The same cannot be said about our competitors. Here’s the proof that they give away bad research on the cheap. Remember, when the product is free, you’re the product.
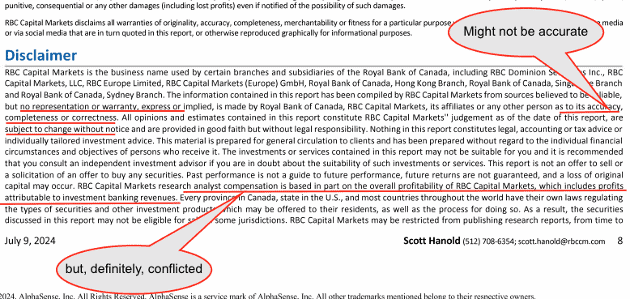
Have you ever read the Disclaimers at the end of a Wall Street research report? You’ll be surprised at what you might find. I have an example for you. From page 8 of a recent report from RBC Securities on Chord Energy Corp (CHRD)[1]. The investment bank admits their research:
-
- does not have to be accurate and
- can be conflicted because the author’s compensation comes from a bank that makes money from investment banking.
Figure 1: Disclaimers from a Wall Street Research Report
Sources: RBC Capital Markets, page 8 of the report on Chord Energy Corp (CHRD)
All Wall Street research reports have very similar disclaimers. Take a look. In fact, among Wall Street insiders, it is common knowledge that Wall Street research is unreliable. And, I am always surprised by how many investors do not realize how ridiculously misleading most investment research is. For a deep dive into the huge conflicts in Wall Street research, see Why Investors Need Independent Research.
Figure 2 shows the RBC analyst’s model for Free Cash Flow for Chord Energy Corp (CHRD). Wow, the free cash flow is quite positive according to RBC.
Figure 2: Free Cash Flow Calculations from the RBC report
Sources: RBC Capital Markets, page 8 of the report on Chord Energy Corp (CHRD)
Figure 3 shows our numbers for Free Cash Flow….wait for it…surprise…our numbers are much lower, even negative. For 2022, RBC shows +$1,309 vs. -$2,122 for us. For 2023, RBC shows +$759 vs. -$20 for us. Our model does not cover the company prior to its transition in 2021 from Oasis Petroleum, so we show less history. But, you get the point, we have much lower numbers for Free Cash Flow. Why, you ask? Perhaps, since we are not trying to get investment banking business from this company, we’re not incentivized to overstate its profitability, and, so, we can be trusted to plainly report the truth.
Figure 3: Free Cash Flow Calculations from New Constructs
Sources: New Constructs’ Rating Breakdown details from Professional Membership
The truth is no one can be 100% sure of the motivations of RBC because of the conflicts of interest stated in their disclaimers.
However…that said, RBC could put all the doubts to rest if they gave us details on how they calculate free cash flow so that we could audit the results and ensure their accuracy. Hmm - good idea. Why doesn’t RBC do that? Why don’t all research analysts do that? Do they not have the data? Do they not want to share it?
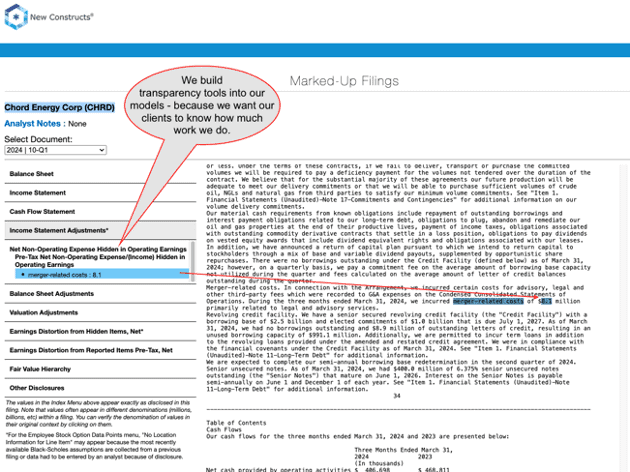
We share it. 100% of the time, right down to the exact details from the footnotes where we get the most important data. We also provide all details on how we calculate Free Cash Flow (FCF) and all the metrics in our models (here). We do the same for the drivers of FCF: NOPAT and Invested Capital.
For example, here’s a picture of where we find an unusual charge buried deep in the footnotes of Chord Energy Corp’s last 10-Q filing.
Figure 4: Example of Key Data Buried in Footnotes that Our Models Capture
Sources: New Constructs and company filings
Now, in case you can’t tell, I really enjoy comparing our research to other firms. And, recently, we found a tweet with a bunch of research and data from Morningstar. Jack pot!
This find allows us to highlight the differences between our calculations of return on invested capital (ROIC), return on equity (ROE), and overall stock rating compared to Morningstar’s research.
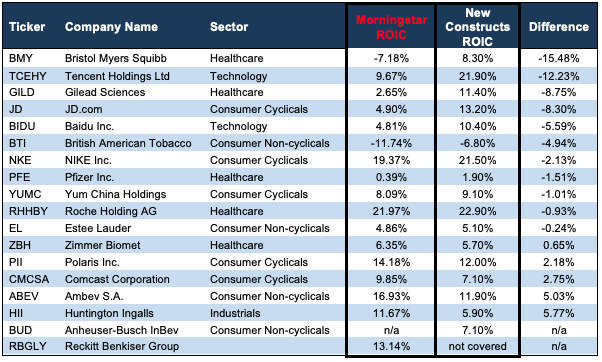
The bottom line: there are very large differences between our research and Morningstar’s. For example:
-
- Morningstar shows Bristol Myers Squibb’s (BMY) ROIC is -7.18%, and we show 8.3%.
- Morningstar shows Tencent Holdings’ (TCEHY) ROIC is 9.67%, and we show 21.9%.
- Morningstar shows Huntington Ingalls’ (HII) ROIC is 11.67%, and we show 5.9%.
More details in Figure 5.
Figure 5: New Constructs vs. Morningstar ROIC

Sources: New Constructs, LLC and Morningstar data from here
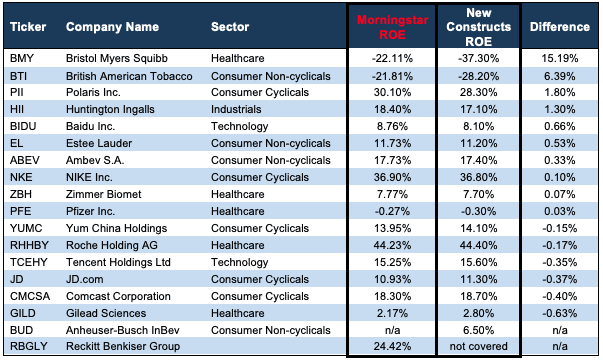
We also see very large differences in the ROE values compared to our research. For example:
-
- Morningstar shows Bristol Myers Squibb’s ROE is -22.11% and we show -37.3%.
-
- Morningstar shows British American Tobacco’s (BTI) ROE is -21.81% and we show -28.20%.
See Figure 6.
Figure 6: New Constructs vs. Morningstar ROE

Sources: New Constructs, LLC and Morningstar data from here
Not surprisingly, our Ratings on the stocks are also quite different. Morningstar ratings are much more positive than ours. For example:
-
- Morningstar gives Pfizer (PFE) a 1 and we give them a 4, or Unattractive rating.
-
- The same goes for Zimmer Biomet (ZBH), Estee Lauder (EL), Huntington Ingalls, and British American Tobacco.
For reference, 1 is the best rating and 5 is the worst for both firms. See Figure 7.
Figure 7: New Constructs vs. Morningstar Stock Ratings

Sources: New Constructs, LLC and Morningstar data from here
I hope you’ve enjoyed this letter as much as I enjoyed writing it. We deliver extremely high value to our clients, and one of the best ways to demonstrate that value is direct comparisons to what our competitors pass off as research.
I also hope this letter helps you see that we genuinely believe in improving the integrity of the stock market and that you get what you pay for when it comes to New Constructs.
There’s a lot of research out there…most of it is fake news. I’m not fake. New Constructs is not fake, and I think it’s hard to make a straight-faced argument that there’s another investment research firm in the world that delivers more value than we do.
Want even more transparency? We regularly review our work and research on Long Ideas and Danger Zone Ideas with clients. We want you to know how much work we do! Get some free samples here:
-
- Free live Podcast once a month. Fridays at 12pm ET. Register here.
- Get free replays from our online community (use this form to sign up for free) and ask questions and make requests anytime!
- Check out the huge amount of media coverage we get here, including my recent interview on Bloomberg TV.
If this message resonated with you and you want to start your investing future with us - schedule a meeting with us here.
Diligence matters,
David Trainer, Founder & CEO
Disclosure: David Trainer, Kyle Guske II, and Hakan Salt, receive no compensation to write about any specific stock, sector, style, or theme.
Questions on this report or others? Join our online community and connect with us directly.
[1] I got a copy of this report from a client. I’m not sure I’m allowed to share the whole thing so I’m only sharing screen shots.


