
For the best financial analysis ratios, look no further. Harvard Business School and MIT Sloan empirically demonstrate the superiority of the data that drives our models and calculations. This paper compares our financial analysis to Bloomberg and Capital IQ (see appendix for details).
Last week, we highlighted how P/E ratios are meaningless, and this week, we’re shining a light in another dark corner of commonly used financial ratios.
Return on equity (ROE), a measure of profitability in relation to the equity in a business, is another popular metric that can mislead investors. From its reliance on accounting earnings to its susceptibility to manipulation (often to benefit executive compensation), ROE lacks the necessary analytical rigor to support diligent investment decisions. Investors that rely on ROE are in the Danger Zone.
Unattractive Stocks with Misleading “Profitability”
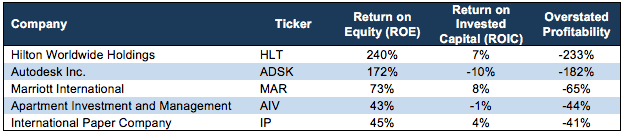
For a number of reasons that we’ll discuss below, ROE can make companies appear much more profitable than they truly are. Figure 1 highlights the five Unattractive-or-worse rated stocks with the most misleading ROEs in the S&P 500.
Figure 1: ROE Vs. Enterprise Value/Invested Capital for S&P 500
Sources: New Constructs, LLC and company filings
Based on ROE, investors are led to believe that each of the companies in Figure 1 are highly profitable. However, return on invested capital (ROIC)[1] tells a different story. ROIC removes the impact of unusual one-time charges, hidden off-balance sheet items, and financial leverage to calculate the true profitability of a firm.
ROE is No Shortcut for Diligence
The disconnect between ROE and ROIC can be explained through ROE’s surface-level analysis. Return on equity has a very simple formula:
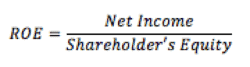
It’s tempting to think of ROE as an easier-to-calculate version of return on invested capital (ROIC). After all, it is meant to measure profits relative to the investment in a business. All you need to do is find the net income line on the income statement and divide it by the shareholder’s equity line on the balance sheet. However, this simplicity means ROE has several flaws that keep it from being a consistently useful metric.
Flaw #1: It’s Based on Accounting Earnings
We’ve long warned that GAAP financial statements fail to meet equity investors’ analytical needs. GAAP rules were designed for debt investors, and GAAP net income has a number of issues that make it especially poor at measuring profitability.
- Accounting loopholes distort reported earnings.
- Little enforcement in place to keep executives from manipulating earnings.
- Changing accounting rules and differing interpretations mean net income is not necessarily comparable over time or between companies.
ROIC, instead of ROE, fixes these issues by using net operating profit after tax (NOPAT) as the numerator. Unlike GAAP net income, NOPAT excludes financing costs, uses consistent rules across all companies and timeframes, and adjusts out the impact of unusual items and changing management assumptions.
Flaw #2: Off-Balance Sheet Items Are Ignored
Companies have all sorts of tools they can use in order to hide assets off the balance sheet. One of those tricks, using operating leases as off-balance sheet debt, is going away soon, and will have a significant impact on corporate balance sheets, as we detailed here. For example, both Hilton Worldwide (HLT) and Autodesk (ADSK), from Figure 1, have off-balance-sheet operating leases greater than 10% of reported net assets. We’ve always included these operating leases when calculating invested capital, the denominator in our ROIC calculation.
In addition, there are other hidden off-balance sheet items, such as reserves, deferred compensation, and asset write-downs. These all represent committed capital for which the company is not being held accountable in ROE. These items showcase how accounting rules serve the needs of debt investors more than equity investors. Writing-down assets helps debt investors by giving a clearer picture of the liquidation value of a company, but it hurts equity investors by obscuring the true amount of capital invested in the business.
We use invested capital for the denominator in our ROIC calculation because it factors in these hidden items (unlike shareholder’s equity) so that the company is being held accountable for all of its uses of capital.
Flaw #3: Leverage Influences ROE
A true measure of profitability should reflect the operations of the business without being impacted by financing decisions. With shareholder’s equity as its denominator, ROE is highly susceptible to financing decisions, as a company can significantly boost ROE by taking on debt, regardless of the increased level of risk debt adds.
The opposite also holds true. A company with a great deal of excess cash will be penalized with a lower ROE, even though it’s operations are highly profitable and earning a very high ROIC.
As an example, compare Marriott International (MAR) from Figure 1 and its peer, Las Vegas Sands (LVS). With a ROE of 73%, Marriott appears more profitable than Las Vegas Sands with a ROE of 55%. The cause of the distortion here is Marriott’s higher total debt, equal to 27% of is market cap) and Las Vegas Sands’ large amount of excess cash ($4.4 billion or 11% of market cap).
When we focus on the operations and remove the impact of leverage and excess cash, we see that LVS’s ROIC is nearly three times higher than Marriott’s.
Flaw #4: Executives Have an Interest in Manipulating ROE
ROE is another one of the “advanced” or “non-GAAP” metrics that companies often use to set performance targets for executives’ annual and long-term bonuses. Linking compensation to a manipulatable metric means executives are more likely to manipulate it. That’s human nature. And, it’s relatively easy to manipulate accounting earnings, structure transactions to keep them off the balance sheet, and take on more leverage in order to boost ROE.
Because ROE is so easy to manipulate and executives potentially have such a strong interest in artificially boosting it, investors can’t know whether that ROE number is reliable or just a result of financial chicanery. One company might have a significantly higher ROE than a competitor simply because it’s more aggressively exploiting accounting loopholes rather than being superior in terms of profitability.
ROE Fails to Measure Value Creation
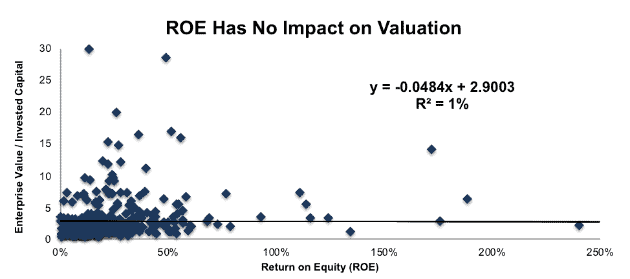
The ease with which ROE can be manipulated, as well as its various structural flaws, explain why it has almost no value in terms of explaining differences in valuation as Figure 2 shows. As we see so often in the market, simplicity is not always a virtue. ROIC might not be as simple to calculate, but it’s a much better indicator of profitability and valuation.
Figure 2: ROE Vs. Enterprise Value/Invested Capital for S&P 500
Sources: New Constructs, LLC and company filings
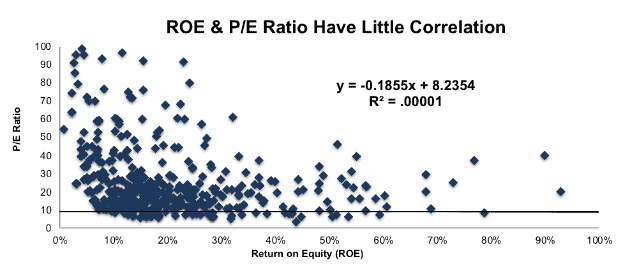
Figure 2 shows the relationship (or lack thereof), between ROE and enterprise value/invested capital, which is a cleaner version of price to book. Only 1% of the difference in valuation between S&P 500 companies can be explained through ROE. A similarly nonexistent relationship results when we plot ROE against the P/E ratio, per Figure 3.
Figure 3: ROE Vs. P/E for the S&P 500
Sources: New Constructs, LLC and company filings
ROIC is the True Driver of Valuation
Figure 4 shows that ROIC is highly correlated with enterprise value/invested capital. ROIC explains over half of the difference in valuations between S&P 500 companies. This correlation means companies that improve their ROIC (not ROE) are more likely to see their stock prices rise.
Numerous case studies show that getting ROIC right is an important part of making smart investments. Ernst & Young recently published a white paper that proves the material superiority of our forensic accounting research and measure of ROIC. The technology[2] that enables this research is featured by Harvard Business School.
Figure 4: ROIC Vs. Enterprise per Invested Capital for the S&P 500
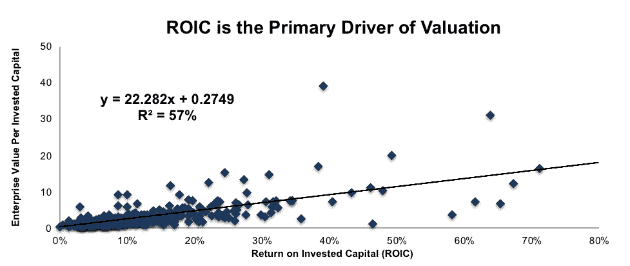
Sources: New Constructs, LLC and company filings
The evidence above is clear. No meaningful relationship exists between ROE and P/E or enterprise value/invested capital, while the relationship between valuation and ROIC is strong. Investors who rely on ROE won’t just get a misleading view of the market, they’ll mistakenly believe that an expensive stock like MAR is a value, and that a value stock like LVS is expensive.
Read our previous article "4 Reasons ROE Is Not A Useful Metric For Investors."
This article originally published on November 19, 2018.
Disclosure: David Trainer, Kyle Guske II, and Sam McBride receive no compensation to write about any specific stock, sector, style, or theme.
Follow us on Twitter, Facebook, LinkedIn, and StockTwits for real-time alerts on all our research.
[1] Ernst & Young’s recent white paper “Getting ROIC Right” proves the superiority of our holdings research and analytics.
[2] Harvard Business School features the powerful impact of our research automation technology in the case New Constructs: Disrupting Fundamental Analysis with Robo-Analysts.
2 replies to "Don’t Get Misled by Return on Equity (ROE)"
How do you reconcile this with the fact that Warren Buffet loves ROE as a metric?
If you look at Buffet’s shareholder letters, he talks more about ROIC than ROE. See his 2007 letter where he writes, “A truly great business must have an enduring “moat” that protects excellent returns on invested capital.”
When Buffett does talk about ROE, it’s usually in the context of businesses that have little-to-no debt, so they’re not impacted by leverage. And you can be sure that Buffett, who spends all day reading 10-Ks, is not getting fooled by the accounting distortions and non-recurring items that impact traditional calculations of ROE.