
GAAP earnings remain overstated despite all eleven sectors of the NC 2000[1], our All Cap Index, achieving a year-over-year (YoY) rise in Core Earnings in 2021, just as they did in 3Q21.
This report is an abridged and free version of All Cap Index & Sectors: Core Earnings Vs. GAAP Earnings Thru 2021, one of our quarterly series on fundamental market and sector trends. The full version of the report analyzes Core Earnings[2][3] and GAAP earnings of the NC 2000[4] and each of its sectors. Last quarter’s analysis is here. The full report is available to clients with a Pro or higher membership or can be purchased here.
Accounting Distortions Across the NC 2000
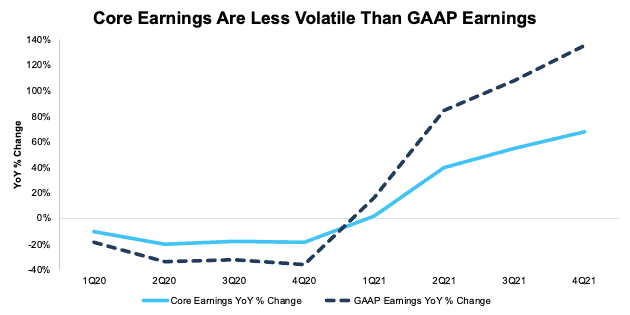
Figure 1 shows Core Earnings, which adjust for unusual gains/losses, are less volatile than GAAP earnings in the NC 2000. For instance:
- In 2021, GAAP earnings rose 135% YoY compared to a 68% rise for Core Earnings.
- In 2020, GAAP earnings fell 36% YoY compared to a 19% fall for Core Earnings.
At the end of 2020, Core Earnings of $1.2 trillion were 34% higher than GAAP earnings of $896 billion. Now, at the end of 2021, Core Earnings of $2.0 trillion are 4% less than GAAP earnings of $2.1 trillion.
Figure 1: NC 2000 Core Earnings Vs. GAAP Earnings YoY Percent Change: 1Q20 – 4Q21
Sources: New Constructs, LLC and company filings.
Our Core Earnings analysis is based on aggregated TTM data for the sector constituents in each measurement period.
The 4Q21 period incorporates financial data from 2021 10-Ks, which became available for all NC 2000 constituents as of March 11, 2022.
All of our research leverages more reliable fundamental data[5] that overcomes flaws with legacy fundamental datasets to provide a more informed view of macro fundamentals and a new source of alpha.
2021 GAAP Earnings Widely Overstated[6]
For 795 of the companies in, the NC 2000, 40% of the index, GAAP Earnings overstate Core Earnings for calendar year 2021. When GAAP Earnings overstate Core Earnings, they do so by an average of 100%, per Figure 2. The overstatement was more than ten percent of GAAP Earnings for 20% of companies.
The 795 companies with overstated GAAP earnings make up 54% of the market cap of the NC 2000.
Figure 2: NC 2000 GAAP Earnings Overstated by 100% On Average

Sources: New Constructs, LLC and company filings.
We use Funds from Operations (FFO) for Real Estate companies rather than GAAP Earnings.
Key Details on Select NC 2000 Sectors
The Energy sector saw the largest YoY percentage improvement in Core Earnings, which rose from $1.7 billion in 2020 to $111.1 billion in 2021.
The Technology sector generates the most Core Earnings, at $479.4 billion, and grew Core Earnings by 44% YoY in 4Q21. On the flip side, the Real Estate sector has the lowest Core Earnings at $34.6 billion, and the Consumer Non-cyclicals sector, at just 7%, had the weakest YoY growth in 4Q21.
Below we highlight the Financials sector and a stock with some of the most Earnings Distortion (i.e. overstated GAAP earnings) in the sector.
Sample Sector Analysis[7]: Financials
Figure 3 shows Core Earnings for the Financials sector, at $456.3 billion, rose 78% YoY in 2021, while GAAP earnings, at $516.5 billion, rose 93% over the same time.
Figure 3: Financials Core Earnings Vs. GAAP: 1998 – 2021

Sources: New Constructs, LLC and company filings.
Our Core Earnings analysis is based on aggregated TTM data for the sector constituents in each measurement period.
The 4Q21 period incorporates financial data from 2021 10-Ks, which became available for all NC 2000 constituents as of March 11, 2022.
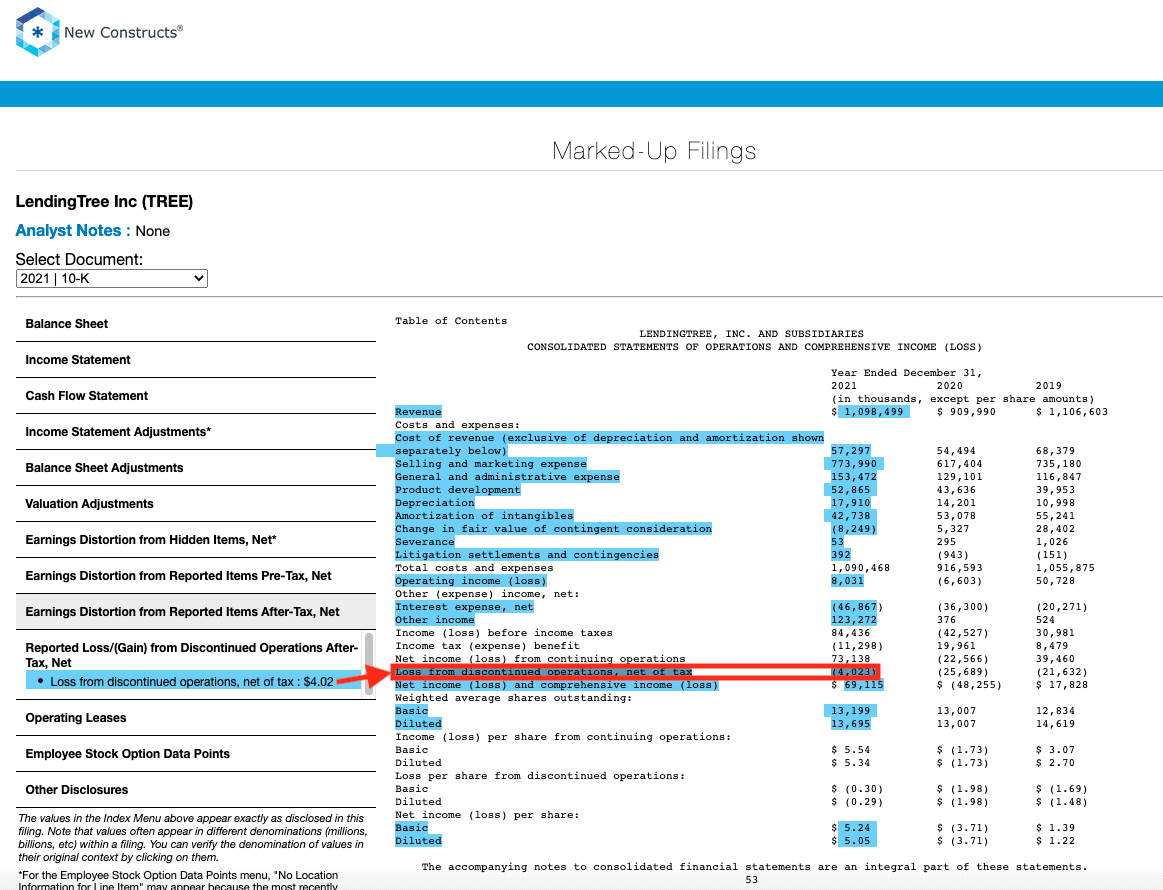
GAAP Earnings Overstatement Details: LendingTree Inc (TREE)
Below, we detail the hidden and reported unusual items that GAAP earnings missed but are captured in Core Earnings for LendingTree Inc (TREE), a stock with some of the most Earnings Distortion, and, therefore, overstated GAAP Earnings, in the Financial sector.
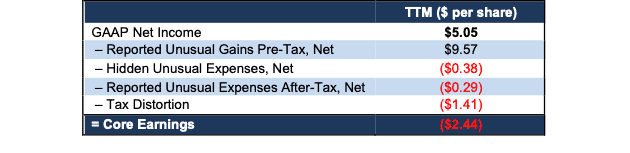
After adjusting for unusual items, we find that LendingTree’s Core Earnings of -$33 million, or -$2.44/share in 2021, are much worse than reported GAAP Earnings of $69 million, or $5.05/share. LendingTree’s Earnings Distortion Score is Strong Miss. Our stock rating for TREE is Unattractive, which means the stock offers poor long-term risk reward.
Figure 4 details the differences between Core Earnings and GAAP Earnings so readers can audit our research.
Figure 4: LendingTree’s GAAP Earnings to Core Earnings Reconciliation
Sources: New Constructs, LLC and company filings.
More details:
Total Earnings Distortion of $7.49/share, which equals $103 million, is comprised of the following:
Reported Unusual Gains Pre-Tax, Net = $9.57/per share, which equals $131 million, and is comprised of:
- $123 million in other income
- $8 million gain from change in fair value of contingent consideration
- -$392 thousand litigation settlements and contingencies expense
- -$53 thousand severance expense
Hidden Unusual Expenses, Net = -$0.38/per share, which equals -$5 million and is comprised of:
- -$3.5 million loss on impairments and disposal of assets – Page 56
- -$1.8 million acquisition expense – Page 44
Reported Unusual Expenses After-Tax, Net = -$0.29/per share, which equals -$4 million and is comprised of:
- -$4 million loss from discontinued operations, net of tax
Tax Distortion = -$1.41/per share, which equals -$19 million
This article originally published on April 6, 2022.
Disclosure: David Trainer, Kyle Guske II, and Matt Shuler receive no compensation to write about any specific stock, style, or theme.
Follow us on Twitter, Facebook, LinkedIn, and StockTwits for real-time alerts on all our research.
Appendix: Calculation Methodology
We derive the Core Earnings and GAAP Earnings metrics above by summing the trailing-twelve-month individual NC 2000 constituent values for Core Earnings and GAAP Earnings in each sector for each measurement period. We call this approach the “Aggregate” methodology.
The Aggregate methodology provides a straightforward look at the entire sector, regardless of market cap or index weighting and matches how S&P Global (SPGI) calculates metrics for the S&P 500.
[1] The NC 2000 consists of the largest 2000 U.S. companies by market cap in our coverage. Constituents are updated on a quarterly basis (March 31, June 30, September 30, and December 31). We exclude companies that report under IFRS and non-U.S. ADR companies.
[2] Core Earnings enable investors to overcome the flaws in legacy fundamental data and research, as proven in Core Earnings: New Data & Evidence, written by professors at Harvard Business School (HBS) & MIT Sloan for The Journal of Financial Economics.
[3] Based on the latest audited financial data, which is the 10-K for calendar 2021 in most cases.
[4] The NC 2000 consists of the largest 2000 U.S. companies by market cap in our coverage. Constituents are updated on a quarterly basis (March 31, June 30, September 30, and December 31). We exclude companies that report under IFRS and non-U.S. ADR companies.
[5] Three independent studies prove the superiority of our data, models, and ratings. Learn more here.
[6] Overstated companies include all companies with Earnings Distortion >0.1% of GAAP earnings.
[7] The full version of this report provides analysis for all eleven sectors.