
This report is a free, abridged version of S&P 500 & Sectors: Free Cash Flow Yield Rises above Pre-Pandemic Levels, one of our quarterly series on fundamental market and sector trends, available to Pro and higher members.
The full version of this report analyzes[1],[2] free cash flow (FCF), enterprise value, and the trailing FCF yield for the S&P 500 and each of its sectors (last quarter’s analysis is here).
These reports leverage more reliable fundamental data[3] that overcomes flaws with legacy fundamental datasets to provide a more informed view of the fundamentals and a new source of alpha.
S&P 500 FCF Yield in Q4 Rose above Pre-Pandemic Levels
2021 was a very profitable year for the S&P 500. Cash flows rose faster than stock prices as the index’s free cash flow (FCF) yield rose to its highest level since 12/31/18. The trailing FCF yield for the S&P 500 rose from 1.1% on 3/31/21 to 2.2% as of 3/11/22. Before the pandemic, the FCF yield for the S&P 500 was 2.0% on 3/31/20.
See Figure 1 in the full version of our report for the chart of FCF Yield for the S&P 500 from December 2004 thru 3/11/22[4].
Nine S&P 500 sectors saw an increase in trailing FCF yield from 3/31/21 to 3/11/22.
Key Details on Select S&P 500 Sectors
With a 6.8% FCF yield, investors are getting more FCF for their investment dollar in the Basic Materials sector than any other sector. On the flip side, the Real Estate sector, at -4.1%, currently has the lowest trailing FCF yield of all S&P 500 sectors.
The Basic Materials, Financials, Industrials, Healthcare, Telecom Services, Utilities, Consumer Cyclicals, Energy, and Consumer Non-cyclicals sectors each saw an increase in trailing FCF yield from 3/31/21 to 3/11/22.
Below, we highlight the Industrials sector.
Sample Sector Analysis[5]: Industrials
Figure 1 shows trailing FCF yield for the Industrials sector rose from 0.0% as of 3/31/21 to 2.9% as of 3/11/22. The Industrials sector FCF rose from -$1.1 billion in 2020 to $120.0 billion in 2021, while enterprise value fell from $4.3 trillion as of 3/31/21 to $4.1 trillion as of 3/11/22.
Figure 1: Industrials Trailing FCF Yield: December 2004 – 3/11/22
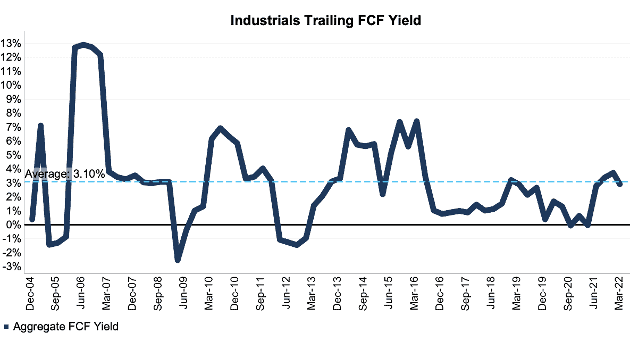
Sources: New Constructs, LLC and company filings.
The March 11, 2022, measurement period uses price data as of that date and incorporates the financial data from 2021 10-Ks, as this is the earliest date for which all the 2021 10-Ks for the S&P 500 constituents were available.
Figure 2 compares the trends in FCF and enterprise value for the Industrials sector since 2004. We sum the individual S&P 500/sector constituent values for free cash flow and enterprise value. We call this approach the “Aggregate” methodology, and it matches S&P Global’s (SPGI) methodology for these calculations.
Figure 2: Industrials FCF & Enterprise Value: December 2004 – 3/11/22
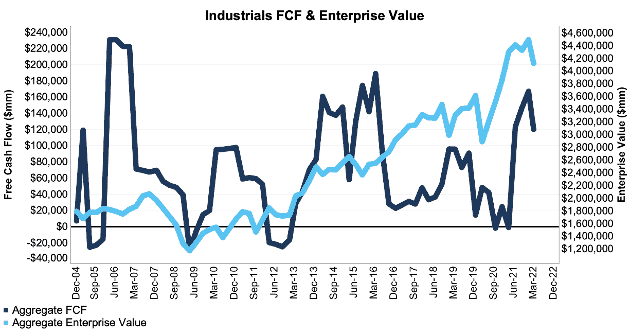
Sources: New Constructs, LLC and company filings.
The March 11, 2022, measurement period uses price data as of that date and incorporates the financial data from 2021 10-Ks, as this is the earliest date for which all the 2021 10-Ks for the S&P 500 constituents were available.
The Aggregate methodology provides a straightforward look at the entire S&P 500/sector, regardless of market cap or index weighting, and matches how S&P Global (SPGI) calculates metrics for the S&P 500.
For additional perspective, we compare the Aggregate method for free cash flow with two other market-weighted methodologies: market-weighted metrics and market-weighted drivers. Each method has its pros and cons, which are detailed in the Appendix.
Figure 3 compares these three methods for calculating the Industrials sector’s trailing FCF yields.
Figure 3: Industrials Trailing FCF Yield Methodologies Compared: December 2004 – 3/11/22
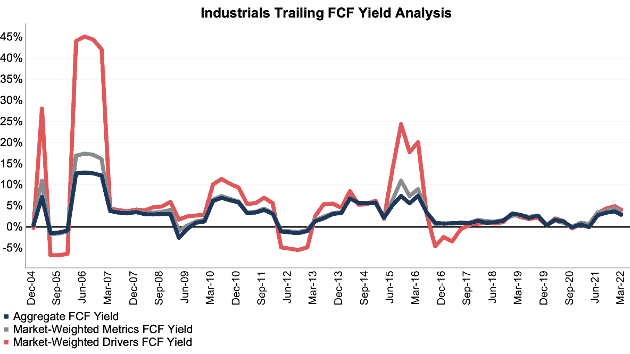
Sources: New Constructs, LLC and company filings.
The March 11, 2022, measurement period uses price data as of that date and incorporates the financial data from 2021 10-Ks, as this is the earliest date for which all the 2021 10-Ks for the S&P 500 constituents were available.
This article originally published on April 1, 2022.
Disclosure: David Trainer, Kyle Guske II, and Matt Shuler receive no compensation to write about any specific stock, style, or theme.
Follow us on Twitter, Facebook, LinkedIn, and StockTwits for real-time alerts on all our research.
Appendix: Analyzing Trailing FCF Yield with Different Weighting Methodologies
We derive the metrics above by summing the individual S&P 500/sector constituent values for free cash flow and enterprise value to calculate trailing FCF yield. We call this approach the “Aggregate” methodology.
The Aggregate methodology provides a straightforward look at the entire S&P 500/sector, regardless of market cap or index weighting, and matches how S&P Global (SPGI) calculates metrics for the S&P 500.
For additional perspective, we compare the Aggregate method for free cash flow with two other market-weighted methodologies. These market-weighted methodologies add more value for ratios that do not include market values, e.g. ROIC and its drivers, but we include them here, nonetheless, for comparison:
- Market-weighted metrics – calculated by market-cap-weighting the trailing FCF yield for the individual companies relative to their sector or the overall S&P 500 in each period. Details:
- Company weight equals the company’s market cap divided by the market cap of the S&P 500/ its sector
- We multiply each company’s trailing FCF yield by its weight
- S&P 500/Sector trailing FCF yield equals the sum of the weighted trailing FCF yields for all the companies in the S&P 500/sector
- Market-weighted drivers – calculated by market-cap-weighting the FCF and enterprise value for the individual companies in each sector in each period. Details:
- Company weight equals the company’s market cap divided by the market cap of the S&P 500/ its sector
- We multiply each company’s free cash flow and enterprise value by its weight
- We sum the weighted FCF and weighted enterprise value for each company in the S&P 500/each sector to determine each sector’s weighted FCF and weighted enterprise value
- S&P 500/Sector trailing FCF yield equals weighted S&P 500/sector FCF divided by weighted S&P 500/sector enterprise value
Each methodology has its pros and cons, as outlined below:
Aggregate method
Pros:
- A straightforward look at the entire S&P 500/sector, regardless of company size or weighting.
- Matches how S&P Global calculates metrics for the S&P 500.
Cons:
- Vulnerable to impact of companies entering/exiting the group of companies, which could unduly affect aggregate values. Also susceptible to outliers in any one period.
Market-weighted metrics method
Pros:
- Accounts for a firm’s market cap relative to the S&P 500/sector and weights its metrics accordingly.
Cons:
- Vulnerable to outlier results disproportionately impacting the overall trailing FCF yield.
Market-weighted drivers method
Pros:
- Accounts for a firm’s market cap relative to the S&P 500/sector and weights its free cash flow and enterprise value accordingly.
- Mitigates the disproportionate impact of outlier results from one company on the overall results.
Cons:
- More volatile as it adds emphasis to large changes in FCF and enterprise value for heavily weighted companies.
[1] We calculate these metrics based on S&P Global’s (SPGI) methodology, which sums the individual S&P 500 constituent values for market cap and economic book value before using them to calculate the metrics. We call this the “Aggregate” methodology.
[2] Our research is based on the latest audited financial data, which is the 2021 10-K for most companies. Price data is as of 3/11/22.
[3] Three independent studies prove the superiority of our data, models, and ratings. Learn more here.
[4] Our research is based on the latest audited financial data, which is the 2021 10-K for most companies. Price data is as of 3/11/22.
[5] The full version of this report provides analysis for every sector like what we show for this sector.