It is only a matter of time before oil and gas stocks stop moving with the price of oil and start reflecting their underlying economics.
When this happens, Baker Hughes (BHI – “very dangerous” rating) will be among the stocks that fall the hardest.
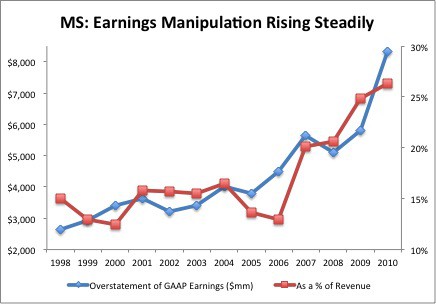
When Morgan Stanley (MS) started in 1935, there were around fifteen employees. For 2010, the company reported 62,542 employees. Bigger is not always better. And for big, publicly-traded companies, big tends to be worse especially when it comes to financial reporting.
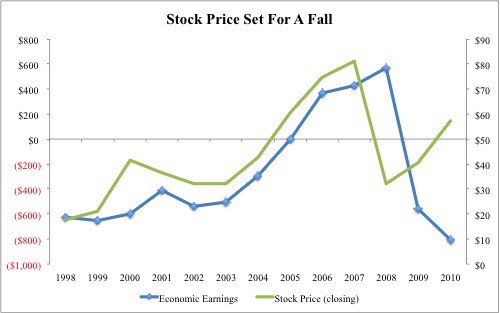
The risk/reward of this stock is quite compelling. Downside risk is low as the valuation already implies a permanent 54% decline in profits. How much worse can the valuation get? Upside reward potential is strong as the stock has to go over $77/share to trade at a value that implies the company’s profits will experience a 0% decline, still a no-growth scenario.
HIDDEN GEMS:
1. Our discounted cash flow analysis shows that APOL’s current valuation (stock price of $42.31) implies that the company’s profits will decline by 60% and never grow again.
2. Economic earnings are higher than reported accounting earnings.
3. Excess cash of $1,201mm or about 20% of its market cap
January’s Most Attractive Stocks are now available.
Technology and Pharmaceutical stocks predominate compared to other sectors. One newcomer to the list, Seagate Technology (STX), is actually an old friend. STX made
We went on record that investors should short SBUX on 11/6/2006 when the stock was close to $38 per share. Click here to see the Fortune Article. The stock did not look attractive to us until 2 years (11/18 – 11/20/08) later when it was under $8, and that for only about 3 days. And ever since we have had a Neutral or Dangerous Rating on the stock.
HIDDEN GEMS:
1. Our discounted cash flow analysis shows that ACN’s current valuation (stock price of $48.59) implies that the company’s profits will decline by 9% and never grow again.
2. Economic earnings are higher than reported accounting earnings.
3. Excess cash of $3,728mm or about 12% of its market cap
RED FLAGS:
1. Misleading earnings: DFS reported a $295mm increase in GAAP earnings while our model shows economic earnings declined by $998mm (a difference of $1,293mm or over 100% of reported net income). The majority of the overstated reported earnings comes from a one-time gain from an anti-trust settlement of $1,892mm.
2. Very dangerous valuation: stock price of $19 implies DFS must grow its NOPAT at over 10% compounded annually for 40 years. A 40-year growth appreciation period with a 10%+ compounding growth rate sets expectations for future cash flow performance quite high. Historical growth rates have never been much lower.
3. Free Cash Flow was -$2,470mm or -26% of the company’s enterprise value last year.
4. Asset write-offs of $428mm or 5% of net assets – this means that management has written off at least $0.05 of assets for every $1 on the current balance sheet. Writing off assets is the opposite of creating shareholder value as it reflects management’s inability to derive any profits for the investments it makes with shareholder funds.
5. Off-balance sheet debt of $38mm or 0.5% of net assets.
6. Outstanding stock option liability of $8mm or less than 1% of current market value.
HIDDEN GEMS:
1. About $15 million in non-operating expenses (after-tax) cause reported earnings to be understated.
2. Our discounted cash flow analysis shows that ADI’s current valuation (stock price of $37.18) implies that the company’s profits will decline by 10% and never grow again.
3. The company grew its economic earnings by $283mm during its last fiscal year.
4. Excess cash of $2,462.5mm or nearly 25% of its market cap
The December version of our Most Attractive Stocks and Most Dangerous Stocks reports are now available for purchase. Note that Barron's recently recognized our Most Attractive Stocks portfolio as #1 over the prior 12 months amongst the best of the Wall Street research firms.
HIDDEN GEMS:
1. About $29 million in non-operating expenses (after-tax) cause reported earnings to be understated.
2. Our dis¬counted cash flow analy¬sis shows that TRV’s cur¬rent val¬u¬a¬tion (stock price of $55.49) implies that the company’s profits will decline by 30% and never grow again.
3. The company grew its economic earn¬ings by $827mm during its last fiscal year.
Today we initiated coverage of ETFs for all major sectors and Indices. Free samples of the initiation reports are here. These reports deliver strategic insights into entire sectors and markets.
The Risk/Reward of the entire S&P 500 gets our Neutral Rating. Our recently published Index Benchmark report on the S&P 500 offers unique insights into the underlying profitability and valuation of all the companies comprised by this index. It also offers benchmarks for (1) investors considering buying ETFs or Index Funds based on the S&P 500 and for (2) comparing individual stocks to the S&P 500.
The Risk/Reward of the entire Russell 2000 gets our Dangerous Rating. Our recently published Index Benchmark report on the Russell 2000 offers unique insights into the underlying profitability and valuation of all the companies comprised by this index. It also offers benchmarks for (1) investors considering buying ETFs or Index Funds based on the Russell 2000 and for (2) comparing individual stocks to the Russell 2000.
HIDDEN GEMS:
1. About $250 million in non-operating expenses (after-tax) cause reported earnings to be understated during the last fiscal year.
2. Our discounted cash flow analysis shows that CL’s current valuation (stock price of $77.52) implies that the company’s profits will decline by 7% and never grow again.
3. The company grew its economic earnings by $229mm (14% increase) during its last fiscal year.
RED FLAGS:
1. Misleading Earnings: RAX reported a $30mm increase in GAAP earnings while our model shows economic earnings declined by $13mm (a difference of $43mm or 7% of revenue).
2. Very Dangerous Valuation: Stock price of $25.636 implies RAX must grow its NOPAT at 25% compounded annually for 17 years. A 17-year Growth Appreciation Period with a 25% compounding growth rate is quite a high standard to beat, as per my post on How To Make Money Picking Stocks.
3. Outstanding Stock Option Liability of $205mm or 6.5% of current market value
MSFT released better than expected earnings and is up 8.3% since it was named the Stock Pick of the Week on October 28, 2010. Overt the same time period, the S&P 500 is up only 3.6%.
The second report in our Red Flag series focuses on a little-known earnings Windfall in the Paper and Products Industry. This report is another example of the deep analysis New Constructs performs on all 3000+ companies under coverage. Our expertise is in navigating poor and confusing disclosure in the Financial Footnotes to find the truth about corporate profitability and valuation.