
With her flagship ETF, ARK Innovation Fund (ARKK) down 51% from its 52-week high, Cathie Wood, founder of ARK Invest, is franticly attempting to convince investors that her “disruptive innovation” strategy will work again. We disagree. ARKK’s portfolio is filled with cash-burning companies that continue to trade at nosebleed valuations. These companies, along with the ARK Innovation Fund, are in the Danger Zone.
Burning Cash Is Not a Competitive Advantage
Too many companies are built on strategies that assume access to cheap capital is a lasting competitive advantage. Who can blame them? Their stocks have soared on a rising tide of investor ebullience driven by ultra-easy monetary policy. Who can blame investors for their ebullience? For most of the last decade, they’ve seen frighteningly little downside risk in stocks. But times are changing, and as monetary policy tightens, the once high-flying cash-burning “innovation” stocks have much farther to fall.
Figure 1 shows that 28 of the 32 ARKK holdings under our coverage generate negative free cash flow (FCF) and have negative FCF yields over the trailing-twelve months (TTM). ARKK currently holds an additional six stocks not under our coverage.
Figure 1: Free Cash Flow for ARKK’s Holdings Is Poor – as of 2/25/22
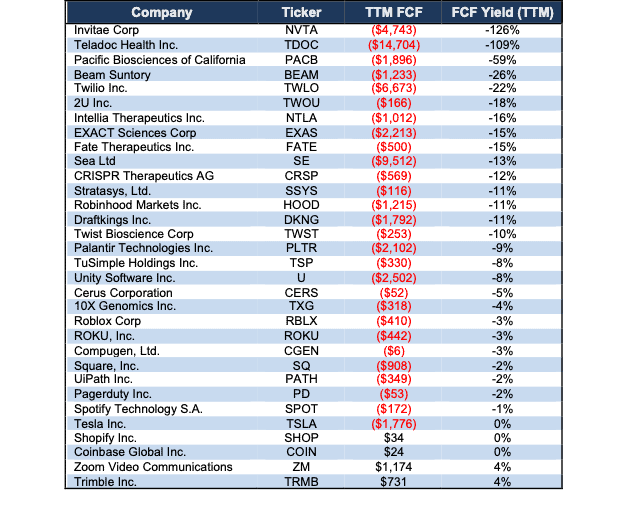
Sources: New Constructs, LLC, company, and ETF filings
Innovation Alone Is Not a Good Investment
Of course, ARKK doesn’t look specifically for cash-burning businesses. ARK Innovation ETF’s principal investment strategy is to invest in stocks that fit a “disruptive innovation” theme. ARK Invest believes “disruptive innovation” is the "introduction of a technologically-enabled new product or service that potentially changes the way the world works.”
Changing the world is certainly a bold goal and flashy selling point for raising money, and this approach has garnered ARK Invest a loyal following and $28 billion in AUM at its peak. However, innovation alone does not make a great company or investment thesis. Instead, one must find the companies that match innovation with a real business model – one that generates real FCF at a reasonable price – for investors to see gains.
Otherwise, investors are simply buying hype and hoping that other investors will play the greater fool and buy in at a higher price. We advise against being another investor’s exit strategy and buying stock in companies without a real business model or defensible moat.
Fundamentals Might Not Be Sexy, But You Can Trust Them
Our focus on quantifiable fundamental benchmarks, instead of just using qualitative research and flashy selling points, has already led us to put five of ARKK’s holdings, 23% of the portfolio, in the Danger Zone. See Figure 2.
Without reliable fundamental data to accurately measure both profitability[1] and valuation, ARKK routinely invests in companies with poor profitability at prices that imply unrealistic future profit growth.
Figure 2: ARKK Holdings That are Also Danger Zone Picks – as of 2/25/22
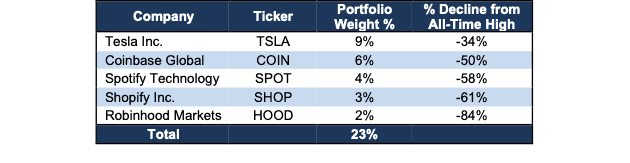
Sources: New Constructs, LLC and ETF filings
Our Fundamental Research on ARRK’s Holdings Reveals a Low-Quality Portfolio
Our Predictive ETF Rating for ARKK is Very Unattractive (equivalent to Morningstar’s 1 Star). Meanwhile, Morningstar gives the ETF a 3 Star rating. Our ETF research is different from legacy fund research because it is forward-looking and based on our risk/reward analysis of each individual fund holding. Most legacy fund research is backward-looking because it is based on past price performance.
ARKK’s Very Unattractive rating means that its holdings have both low profitability and expensive valuations. Our detailed holdings analysis, made possible by our Robo-Analyst technology[2], also reveals that ARKK has a much lower-quality portfolio compared to benchmarks, Invesco QQQ Trust (QQQ) and State Street SPDR S&P 500 ETF (SPY).
Per Figure 3, ARKK allocates 58% of its portfolio to Unattractive-or-worse rated stocks compared to just 9% for QQQ. At the same time, ARKK’s exposure to Attractive-or-better rated stocks is much lower, at 9%, versus QQQ at 29%.
Figure 3: ARK Innovation ETF Allocates to Far Worse Stocks than QQQ
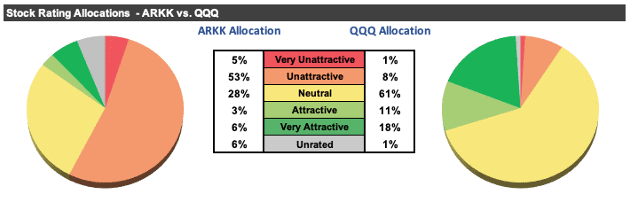
Sources: New Constructs, LLC, company, and ETF filings
Our holdings analysis also reveals ARKK’s portfolio is much lower quality than the S&P 500, or State Street SPDR S&P 500 ETF. See Figure 4 for comparison.
Figure 4: ARK Innovation ETF Allocates to Far Worse Stocks than SPY
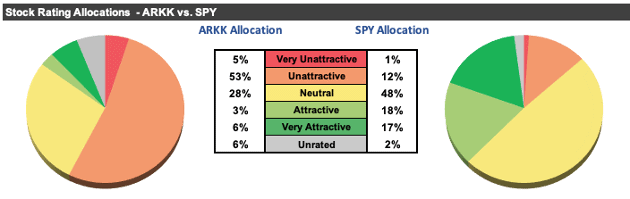
Sources: New Constructs, LLC, company, and ETF filings
Expensive Stocks Drive Very Unattractive Risk/Reward Rating
Figure 5 contains our detailed rating for ARKK, which includes each of the criteria we use to rate all ETFs and mutual funds under coverage. These criteria are the same for our Stock Rating Methodology, because the performance of an ETF’s holdings equals the performance of an ETF after fees.
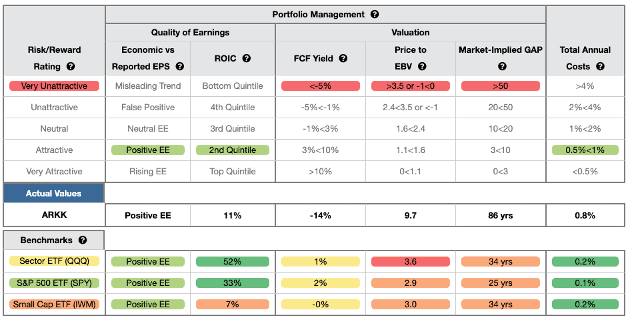
Figure 5: ARK Innovation ETF Rating Details
Sources: New Constructs, LLC, company, and ETF filings
As Figure 5 shows, ARKK is inferior to QQQ (click here for our report on QQQ) and SPY in four of the five criteria that make up our holdings/Portfolio Management analysis. Specifically:
- ARKK’s ROIC is 11%, below the 52% earned by QQQ and 33% earned by SPY
- ARKK’s free cash flow (FCF) yield of -14% is lower than QQQ’s at 1% and SPY’s at 2%
- the price-to-economic book value (PEBV) ratio for ARKK is 9.7, which is greater than the 3.6 for QQQ and 2.9 for SPY
- our discounted cash flow analysis reveals an average market-implied growth appreciation period (GAP) of 86 years for ARKK’s holdings compared to 34 years for QQQ and 25 years for SPY.
ARKK holds stocks that generate inferior cash flows and have significantly higher valuations compared to both QQQ and SPY. The market expectations for ARKK’s holdings are for profit growth (measured by PEBV ratio) that is nearly 10x above current profits and significantly above the profit growth expectations embedded in QQQ’s and SPY’s holdings.
Expectations Investing: Quantifying the Overvaluation of an ARKK Holding
Below we highlight PagerDuty (PD: $33/share), which is one of the five companies in ARKK’s portfolio that have negative and declining FCF over the past three years. PagerDuty provides a perfect example of the overvalued, cash-burning companies that make up ARKK’s portfolio.
While PagerDuty may be the most recent digital operations management platform to hit the market (IPO’d in 2019), its products are, by no means, innovative to the point of changing the world. Larger competitors Atlassian (TEAM) and Splunk (SPLK) offer similar products alongside a larger suite of software solutions. In Atlassian’s case, its competing service can be purchased standalone or is included as a feature of its more robust service management platform.
Given larger and more established competition, it should be no surprise that from fiscal 2019 to fiscal 2021, PagerDuty burned through a cumulative $712 million (26% of market cap) in FCF. Over the nine-months-ended October 31, 2021, PagerDuty burned an additional $35 million in FCF. Figure 6 illustrates PagerDuty’s consistent cash burn.
Figure 6: PagerDuty’s -$747 Million Free Cash Flow Burn Since 2019
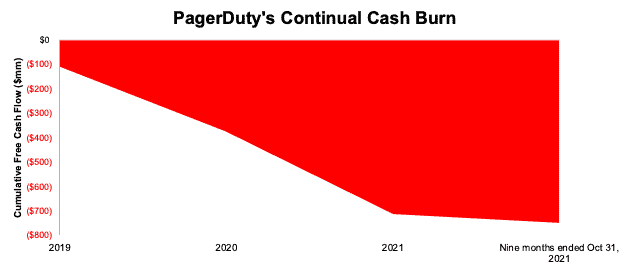
Sources: New Constructs, LLC and company filings
Not only does PagerDuty’s business burn significant cash, but it is also becoming even more unprofitable.
PagerDuty’s net operating profit after-tax (NOPAT) has fallen from -$32 million in fiscal 2018 to -$88 million over the TTM. NOPAT margin remains highly negative, at -34% over the TTM, and is down from -27% in fiscal 2021. The company’s ROIC has been negative since its IPO (took place in 2019) and declined from -11% in fiscal 2021 to -14% over the TTM.
Objective Math: PagerDuty is Overvalued
Despite falling 38% from its 52-week high, PagerDuty remains significantly overvalued and priced to be more profitable than Atlassian, its largest competition. Below, we use our reverse discounted cash flow (DCF) model to analyze the expectations for future growth in cash flows baked into PagerDuty’s current share price and show that it could fall 91%+ further.
To justify its current price of $33/share, PagerDuty must:
- improve its NOPAT margin to 10% (double Atlassian’s best ever margin and much higher than PagerDuty’s current -34% TTM margin), and
- grow revenue by 30% compounded annually for the next nine years (above average consensus estimates for a 25% CAGR from fiscal 2022 through fiscal 2024).
In this scenario, PagerDuty would generate $2.3 billion in revenue in fiscal 2030, which is 9x its TTM revenue. At $2.3 billion, PagerDuty’s revenue would be 93% and 90%, respectively, of Atlassian’s and Splunk’s TTM revenue, it two main competitors.
This scenario also implies that PagerDuty’s NOPAT in fiscal 2030 would reach $227 million, up from -$88 million over the TTM. $227 million in NOPAT would be 6x Atlassian’s TTM NOPAT and 2x Atlassian’s fiscal 2021 NOPAT (highest in company history). Splunk currently generates a negative NOPAT.
We think it’s overly optimistic to assume PagerDuty will immediately improve margins that double its larger competition while also growing revenue faster than consensus estimates. Furthermore, companies that grow revenue by 20%+ compounded annually for such a long period are unbelievably rare, which make the expectations in PagerDuty’s share price even more unrealistic. In a more realistic scenario, detailed below, the stock has large downside risk.
79%+ Downside if Consensus is Right
Here’s an additional DCF scenario to highlight the downside risk if PagerDuty’s revenue grows in-line with consensus estimates and the company can achieve margins equal to Atlassian’s highest ever margin.
If we assume PagerDuty’s:
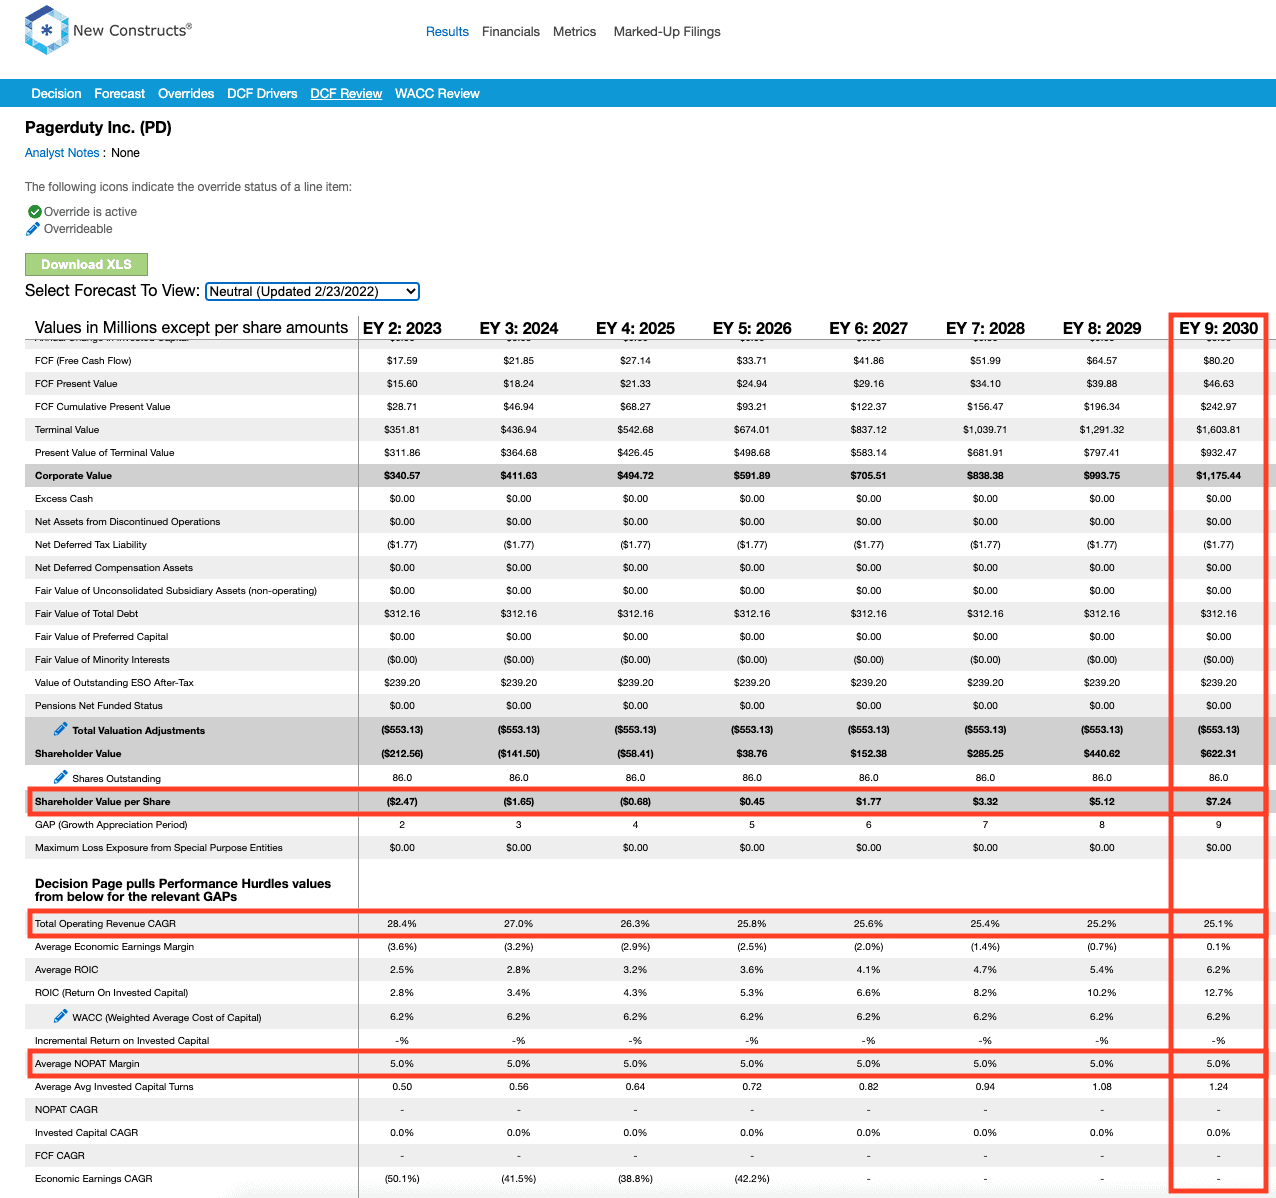
- NOPAT margin improves to 5% (compared to -34% TTM),
- revenue grows at consensus rates in fiscal 2022, 2023, and 2024, and
- revenue grows 24% a year from fiscal 2025-2030 (continuation of fiscal 2024 consensus estimate), then
the stock is worth $7/share today – a 79% downside to the current price. This scenario still implies PagerDuty’s fiscal 2030 revenue is 6x higher than TTM levels and fiscal 2030 NOPAT is over 2x Atlassian’s TTM NOPAT.
If PagerDuty fails to grow revenue at consensus rates, the downside risk in the stock is even higher.
91%+ Downside If Revenue Growth Slows to Industry Expectations
We review a third DCF scenario to highlight the downside risk if PagerDuty’s growth slows to equal the overall IT operations growth rate beyond fiscal 2024.
If we assume PagerDuty’s:
- NOPAT margin improves to 5%,
- revenue grows at consensus rates in fiscal 2022, 2023, and 2024, and
- revenue grows 17% from fiscal 2025-2030 (equal to projected industry CAGR through 2027), then
the stock is worth just $3/share today – a 91% downside to the current price.
Figure 7 compares PagerDuty’s implied future NOPAT in these three scenarios to its historical NOPAT. For reference, we include the TTM NOPAT of Atlassian.
Figure 7: PagerDuty’s Historical and Implied NOPAT: DCF Valuation Scenarios
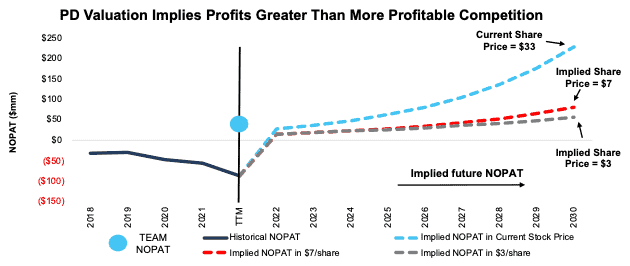
Sources: New Constructs, LLC and company filings.
Each of the above scenarios also assumes PagerDuty grows revenue, NOPAT, and FCF without increasing working capital or fixed assets. This assumption is highly unlikely but allows us to create best-case scenarios that demonstrate the expectations embedded in the current valuation. For reference, PagerDuty’s invested capital grew 123% compounded annually from fiscal 2018 to fiscal 2021. If we assume PagerDuty’s invested capital increases at a similar rate in DCF scenarios 2 and 3 above, the downside risk is even larger.
Overhyped and Overpriced
Compounding the issues above, ARKK charges investors above average fees for below average portfolio allocation. At 0.83%, ARKK’s total annual costs (TAC) are higher than 88% of the 76 Technology ETFs under coverage. For comparison, the simple average TAC of all the Technology ETFs under coverage is 0.57%, the asset-weighted average is 0.34%, QQQ charges just 0.22%, and SPY has total annual costs of just 0.10%. Why pay higher fees for inferior stock selection?
Get an Edge from Holdings-Based ETF Analysis Based on Superior Stock Research
We offer clients in-depth reports for all the 7,600+ ETFs and mutual funds under coverage. Click below for a free copy of ARKK’s standard ETF report.
Smart ETF (or fund) investing means analyzing the holdings of each mutual fund. Failure to do so is a failure to perform proper due diligence. Simply buying an ETF or mutual fund based on past performance does not necessarily lead to outperformance. Only through holdings-based analysis can one determine if an ETF’s methodology leads managers to pick high-quality or low-quality stocks.
Most investors don’t realize they can access sophisticated fundamental research[3] that enables investors to overcome inaccuracies, omissions, and biases in legacy fundamental datasets. Our Robo-Analyst technology analyzes the holdings of all 220 ETFs and mutual funds in the Technology sector and ~7,600 ETFs and mutual funds under coverage to avoid “the danger within.” Our diligence on holdings allows us to cut through the noise and identify potentially dangerous funds, like ARK Innovation ETF, that traditional, backward-looking fund research overrates.
Easily Make Any ETF, Even ARKK, Better
As we showed in The Paradigm Shift to Self-Directed Portfolio Construction, new technologies enable investors to create their own funds without any fees while also offering access to more sophisticated weighting methodologies. If, for instance, investors wanted exposure to ARKK’s holdings, but weighted by ROIC, the risk/reward of this customized version of the fund improves, particularly on the Unattractive-or-worse portion of the portfolio:
- 9% of assets to Attractive-or-better rated stocks (equal to ARKK current allocation)
- 28% of assets to Unattractive-or-worse rated stocks (compared to 58% for ARKK).
Compare the quality of stock allocation in our customized version of ARKK vs. as-is ARKK in Figure 8.
Figure 8: ARK Innovation ETF Allocation Could Be Improved
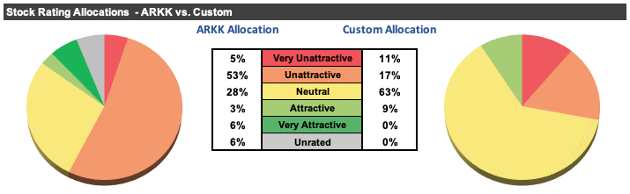
Sources: New Constructs, LLC, company, and ETF filings
Better Alternatives to ARKK: Attractive Technology Funds
Below we present five Technology ETFs or mutual funds that earn an Attractive-or-better rating, have more than $100 million in assets under management, and have below average TAC.
- First Trust NASDAQ Technology Dividend Index Fund (TDIV) – Very Attractive rating – 0.55% TAC
- ETF Series Defiance Quantum ETF (QTUM) – Attractive rating – 0.44% TAC
- State Street Technology Select Sector SPDR Fund (XLK) – Attractive rating – 0.11% TAC
- Nationwide NYSE ARCA Tech 100 Index (NWJEX) – Attractive rating – 0.36% TAC
- iShares U.S. Technology ETF (IYW) – Attractive rating – 0.45% TAC
Check out this week’s Danger Zone interview with Chuck Jaffe of Money Life.
This article originally published on February 28, 2022.
Disclosure: David Trainer, Kyle Guske II, and Matt Shuler receive no compensation to write about any specific stock, sector, style, or theme.
Follow us on Twitter, Facebook, LinkedIn, and StockTwits for real-time alerts on all our research.
[1] Only Core Earnings enable investors to overcome the flaws in legacy fundamental data and research, as proven in Core Earnings: New Data & Evidence, a paper in The Journal of Financial Economics written by professors at Harvard Business School (HBS) & MIT Sloan.
[2] Harvard Business School features the powerful impact of our research automation technology in the case study New Constructs: Disrupting Fundamental Analysis with Robo-Analysts.
[3] See how our models overcome flaws in Bloomberg and Capital IQ’s (SPGI) analytics in the detailed appendix of this paper.