Picking from the multitude of sector ETFs is a daunting task. In any given sector there may be as many as 44 different ETFs, and there are at least 183 ETFs across all sectors.
Why are there so many ETFs? The answer is: because ETF providers are making lots of money selling them. The number of ETFs has little to do with serving investors’ best interests. Below are three red flags investors can use to avoid the worst ETFs:
- Inadequate liquidity
- High fees
- Poor quality holdings
I address these red flags in order of difficulty. Advice on How to Find the Best Sector ETFs is here. Details on the Best & Worst ETFs in each sector are here.
How To Avoid ETFs with Inadequate Liquidity
This is the easiest issue to avoid, and my advice is simple. Avoid all ETFs with less than $100 million in assets. Low levels of liquidity can lead to a discrepancy between the price of the ETF and the underlying value of the securities it holds. In addition, low asset levels tend to mean lower volume in the ETF and large bid-ask spreads.
How To Avoid High Fees
ETFs should be cheap, but not all of them are. The first step here is to know what is cheap and expensive.
To ensure you are paying at or below average fees, invest only in ETFs with an expense ratio below 0.52%, which is the average expense ratio of the 183 US equity ETFs I cover. Weighting the expense ratios by assets under management, the average expense ratio is lower at 0.32%. A lower weighted average is a good sign that investors are putting money in the cheaper ETFs.
Figure 1 shows the most and least expensive sector ETFs in the US equity universe based on total annual costs. ProShares provides four of the most expensive ETFs while Fidelity ETFs are among the cheapest.
Figure 1: 5 Least and Most-Expensive Sector ETFs
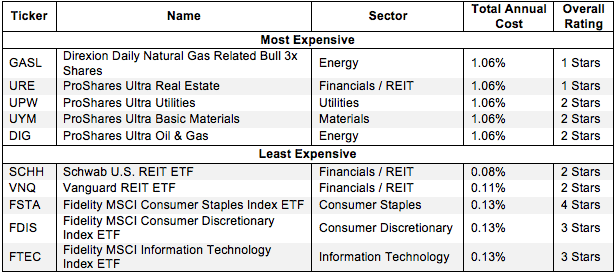 Sources: New Constructs, LLC and company filings
Direxion Daily Natural Gas Related Bull 3x Shares (GASL) and ProShares Ultra Real Estate (URE) are two of the most expensive U.S. equity ETFs I cover, while Schwab U.S. REIT (SCHH) and Vanguard REIT (VNQ) are the least expensive. The more expensive GASL and URE are the worst-rated ETFs in Figure 1 while the cheapest ETFs receive my 2-Star or Dangerous Rating. UYM and DIG are ranked higher than GASL and URE because their superior holdings outweigh their higher costs.
However, investors need not pay high fees for good holdings. Fidelity MSCI Consumer Staples Index ETF (FSTA) is my highest rated sector ETF and earns my Attractive rating. It also has low total annual costs of only 0.13%.
On the other hand, SCHH and VNQ hold poor stocks. And no matter how cheap an ETF, if it holds bad stocks, its performance will be bad.
This result highlights why investors should not choose ETFs based only on price. The quality of holdings matters more than price.
How To Avoid ETFs with the Worst Holdings
This step is by far the hardest, but it is also the most important because an ETF’s performance is determined more by its holdings than its costs. Figure 2 shows the ETFs within each sector with the worst holdings or portfolio management ratings. The sectors are listed in descending order by overall rating as detailed in my 4Q Sector Ratings report.
Figure 2: Sector ETFs with the Worst Holdings
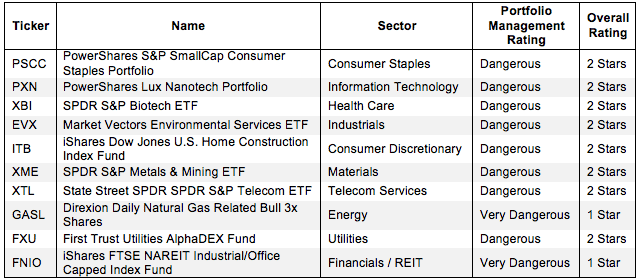 Sources: New Constructs, LLC and company filings
My overall ratings on ETFs are based primarily on my stock ratings of their holdings. My firm covers over 3000 stocks and is known for the due diligence done on each stock we cover.
iShares, PowerShares and SPDR ETFs appear more often than any other providers in Figure 2, which means that they offer the most ETFs with the worst holdings. iShares FTSE NAREIT Industrial/Office Capped Index Fund (FNIO) has the worst holdings of all Financials ETFs. PowerShares S&P SmallCap Consumer Staples Portfolio (PSCC), PowerShares Lux Nanotech Portfolio (PXN), iShares Dow Jones U.S. Home Construction Index Fund (ITB), State Street SPDR SPDR S&P Telecom ETF, and First Trust Utilities AlphaDEX Fund (FXU) all have the worst holdings in their respective sectors.
Note that no ETFs with a dangerous portfolio management rating earn an overall rating better than two stars. These scores are consistent with my belief that the quality of an ETF is more about its holdings than its costs. If the ETF’s holdings are dangerous, then the overall rating cannot be better than dangerous because one cannot expect the performance of the ETF to be any better than the performance of its holdings.
Figure 2 reveals that one of the cheapest ETFs, PSCC, gets a Dangerous rating because its holdings get my Dangerous rating. Similarly, SPDR S&P Biotech ETF (XBI), also one of the cheapest ETFs, gets a Dangerous portfolio management rating and, therefore, cannot earn anything better than a 2-star or Dangerous overall rating. Again, the ETF’s overall rating cannot be any better than the rating of its holdings.
Find the ETFs with the worst overall ratings on my ETF screener. More analysis of the Best Sector ETFs is here.
The Danger Within
Buying an ETF without analyzing its holdings is like buying a stock without analyzing its business and finances. As Barron’s says, investors should know the Danger Within. Put another way, research on ETF holdings is necessary due diligence because an ETF’s performance is only as good as its holdings’ performance.
PERFORMANCE OF ETF’s HOLDINGs = PERFORMANCE OF ETF
Best & Worst Stocks In these ETFs
Newfield Exploration Company (NFX) is one of my least favorite stocks held by GASL and earns my Dangerous rating. NFX has decreased their after-tax profits (NOPAT) by 10% compounded annually over the last four years and has only generated positive economic earnings in only one out of the last seven years. The company earns a return on invested capital (ROIC) of 4%, which puts it in the bottom quintile out of all of the companies that I cover. Despite NFX’s track record of declining profits, NFX is very expensive. To justify its current price of ~$31/share, the company must grow NOPAT by 8% compounded annually over the next 22 years. These expectations seem high for a company with declining profits and poor returns on invested capital. Investors should avoid NFX.
Wal-Mart Stores, Inc. (WMT) is one of favorite holdings in FSTA, the only low-cost ETF in Figure 1 to get my 4-star rating. Wal-Mart has generated positive economic earnings and grown after-tax profits (NOPAT) by 10% compounded annually over the last 15 years. The company is earning a 13% return on invested capital (ROIC), which places it in the top quintile of stocks that I cover. Even with a track record of such strong growth, WMT is undervalued. WMT currently trades at ~$77/share, which gives it a price-to-economic book value ratio of 0.8. This valuation implies that the market expects NOPAT to decline permanently by 20%. Having grown NOPAT by 11% for well over a decade, these expectations for Wal-Mart seem very low. Strong, consistent growth and a cheap valuation make WMT an attractive pick for investors.
Jared Melnyk contributed to this article
Disclosure: David Trainer is long WMT. David Trainer and Jared Melnyk receive no compensation to write about any specific stock, sector, or theme.