
The Materials sector ranks fifth out of the ten sectors as detailed in my Sector Rankings for ETFs and Mutual Funds report. It gets my Dangerous rating, which is based on aggregation of ratings of 11 ETFs and 15 mutual funds in the Materials sector as of April 8, 2014. Prior reports on the best & worst ETFs and mutual funds in every sector are here.
Figure 1 ranks from best to worst the nine Materials ETFs that meet our liquidity standards and Figure 2 ranks from best to worst the ten Materials mutual funds that meet our liquidity standards. Not all Materials sector ETFs and mutual funds are created the same. The number of holdings varies widely (from 30 to 139), which creates drastically different investment implications and ratings. The best ETFs and mutual funds allocate more value to Attractive-or-better-rated stocks than the worst ETFs and mutual funds, which allocate too much value to Neutral-or-worse-rated stocks.
To identify the best and avoid the worst ETFs and mutual funds within the Materials sector, investors need a predictive rating based on (1) stocks ratings of the holdings and (2) the all-in expenses of each ETF and mutual fund. Investors need not rely on backward-looking ratings. My fund rating methodology is detailed here.
Investors should not buy any Materials ETFs or mutual funds because none get an Attractive-or-better rating. If you must have exposure to this sector, you should buy a basket of Attractive-or-better rated stocks and avoid paying undeserved fund fees. Active management has a long history of not paying off.
Get my ratings on all ETFs and mutual funds in this sector on my mutual fund and ETF screener. For more products, click here.
Figure 1: ETFs with the Best & Worst Ratings
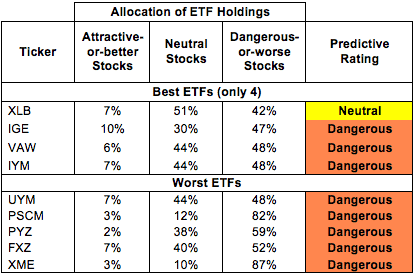 * Best ETFs exclude ETFs with TNAs less than $100 million for inadequate liquidity.
Sources: New Constructs, LLC and company filings
Guggenheim S&P Equal Weight Materials ETF (RTM) and Fidelity MSCI Materials Index ETF (FMAT) are excluded from Figure 1 because their total net assets (TNA) are below $100 million and do not meet our liquidity standards.
Figure 2: Mutual Funds with the Best & Worst Ratings – Top 5
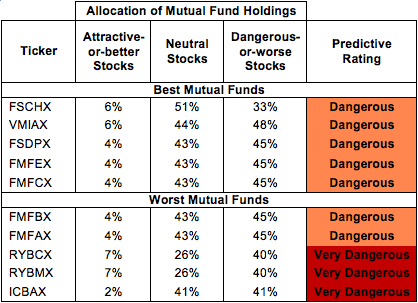 * Best mutual funds exclude funds with TNAs less than $100 million for inadequate liquidity.
Sources: New Constructs, LLC and company filings
State Street SPDR Materials Select Sector SPDR (XLB) is my top-rated Materials ETF and Fidelity Select Portfolios: Chemicals Portfolio (FSCHX) is my top-rated Materials mutual fund. Both earn my Dangerous rating.
State Street SPDR SPDR S&P Metals & Mining ETF (XME) is my worst-rated Materials ETF and ICON Funds: ICON Materials Fund (ICBAX) is my worst-rated Materials mutual fund. XME earns my Dangerous rating and ICBAX earns my Very Dangerous rating.
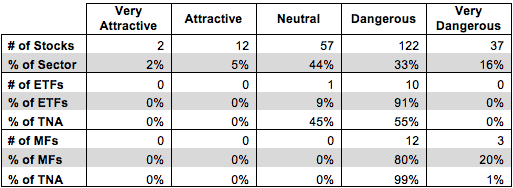
Figure 3 shows that 14 out of the 230 stocks (over 7% of the market value) in Materials ETFs and mutual funds get an Attractive-or-better rating. However, 0 out of 11 Materials ETFs and 0 out of 15 Materials mutual funds get an Attractive-or-better rating.
The takeaways are: mutual fund managers allocate too much capital to low-quality stocks and Materials ETFs hold poor quality stocks.
Figure 3: Materials Sector Landscape For ETFs, Mutual Funds & Stocks
 Sources: New Constructs, LLC and company filings
As detailed in “Cheap Funds Dupe Investors”, the fund industry offers many cheap funds but very few funds with high-quality stocks, or with what I call good portfolio management.
Investors need to tread carefully when considering Materials ETFs and mutual funds, as no ETFs and mutual funds in the Materials sector allocate enough value to Attractive-or-better-rated stocks to earn an Attractive rating. Investors would be better suited to look towards individual stocks for exposure to this sector.
Crown Holdings, Inc. (CCK) is one of my favorite stocks held by Materials ETFs and mutual funds and earns my Attractive rating. Over the past decade, CCK has grown after-tax profit (NOPAT) by 13% compounded annually. The company currently has a return on invested capital (ROIC) of 8% and has generated positive economic earnings since 2008. Despite the steady profit growth, CCK remains undervalued. At the current price of ~$45/share, CCK has a price to economic book value (PEBV) ratio of 1.0. This ratio implies that the market expects CCK to never grow NOPAT from its current level. Even if CCK can only manage low single digit profit growth going forward, the stock has significant potential upside.
Olympic Steel, Inc. (ZEUS) is one of my least favorite stocks held by Materials ETFs and mutual funds and earns my Very Dangerous rating. ZEUS has seen NOPAT decline by 22% compounded annually over the past nine years. The company’s ROIC has declined from 24% in 2004 to only 1% in 2013. To make matters worse, ZEUS has generated positive economic earnings in only one of the past ten years. Despite its declining cash flows, the stock price is up over 30% in the last year. In order to justify the current valuation of ~$28/share, ZEUS would have to grow NOPAT by 12% for the next 44 years. That’s double-digit profit growth for nearly half a century from a company with declining profits. The only value left in ZEUS is as an asset play, but investors shouldn’t count on those assets to prop up the valuation. In 2012 ZEUS was forced to record a $6.6 million write-down of goodwill, and its accumulated write-downs now measure nearly $30 million (6% of net assets). Look for more write-downs going forward for ZEUS that will decrease its accounting book value and hurt its stock price.
154 stocks of the 3000+ I cover are classified as Materials stocks.
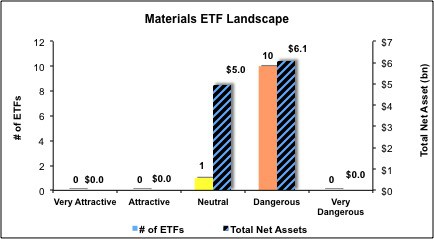
Figures 4 and 5 show the rating landscape of all Materials ETFs and mutual funds.
My Sector Rankings for ETFs and Mutual Funds report ranks all sectors and highlights those that offer the best investments.
Figure 4: Separating the Best ETFs From the Worst ETFs
 Sources: New Constructs, LLC and company filings
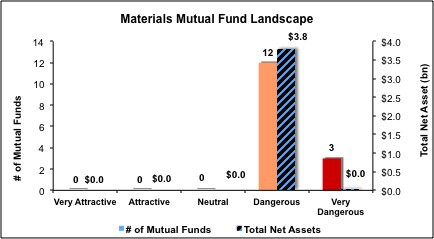
Figure 5: Separating the Best Mutual Funds From the Worst Mutual Funds
 Sources: New Constructs, LLC and company filings
Review my full list of ratings and rankings along with reports on all 11 ETFs and 15 mutual funds in the Materials sector. Click here to protect your portfolio.
Kyle Guske II contributed to this report.
Disclosure: David Trainer and Kyle Guske II receive no compensation to write about any specific stock, sector or theme.