Picking from the multitude of style mutual funds is a daunting task. In any given style there may be as many as 934 different mutual funds, and there are at least 5882 mutual funds across all styles.
Why are there so many mutual funds? The answer is: because mutual fund providers are making lots of money selling them. The number of mutual funds has little to do with serving investors’ best interests. Below are three red flags investors can use to avoid the worst mutual funds:
- Inadequate liquidity
- High fees
- Poor quality holdings
I address these red flags in order of difficulty. Advice on How to Find the Best Style Mutual funds is here. Details on the Best & Worst Mutual funds in each style are here.
How To Avoid Mutual Funds with Inadequate Liquidity
This is the easiest issue to avoid, and my advice is simple. Avoid all mutual funds with less than $100 million in assets. Low asset levels tend to mean lower volume in the mutual fund and large bid-ask spreads.
How To Avoid High Fees
Mutual funds should be cheap, but not all of them are. The first step here is to know what is cheap and expensive.
To ensure you are paying at or below average fees, invest only in, mutual funds with total annual costs (TAC) below 2.02%, which is the average TAC of the 5882 US equity mutual funds I cover. Weighting the TACs by assets under management, the average TAC is lower at 1.37%. A lower weighted average is a good sign that investors are putting money in the cheaper mutual funds.
Figure 1 shows the most and least expensive style mutual funds in the US equity universe based on total annual costs. Rydex provides 2 of the most expensive mutual funds while Fidelity mutual funds are among the cheapest.
Figure 1: 5 Least and Most-Expensive Style Mutual funds
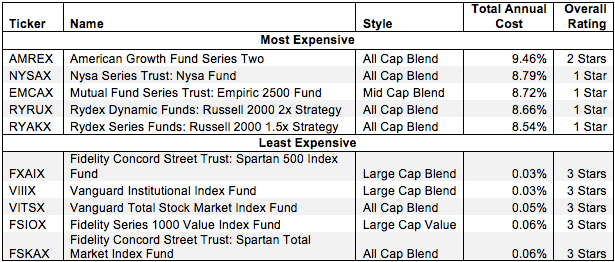 Sources: New Constructs, LLC and company filings
American Growth Fund Series Two (AMREX) and Nysa Series Trust: Nysa Fund (NYSAX) are two of the most expensive U.S. equity mutual funds I cover, while Fidelity Concord Street Trust: Spartan 500 Index Fund (FXAIX) and Vanguard Institutional Index Fund (VIIIX) are the least expensive. The more expensive AMREX and NYSAX receive my 2-star or Dangerous rating and 1-star or Very Dangerous rating respectively. The cheapest mutual funds receive my 3-Star rating. None of the most expensive mutual funds earns a better rating than the cheapest mutual funds. However, a more expensive fund can earn a better rating than a cheap fund. Quality holdings can make up for high costs.
However, investors need not pay high fees for good holdings. Fidelity Concord Street Trust: Spartan 500 Index Fund (FXAIX) earns my Neutral rating. It also has low total annual costs of only 0.03%.
On the other hand, the Fidelity Salem Street Trust: Fidelity Series 1000 Value Index Fund (FSIOX) holds a mixed bag of stocks. Despite their low costs, it earns a 3-star or Neutral rating. No matter how cheap of fund, it needs to hold good stocks to deliver good returns.
This result highlights why investors should not choose mutual funds based only on price. The quality of holdings matters more than price.
How To Avoid Mutual Funds with the Worst Holdings
This step is by far the hardest, but it is also the most important because a mutual fund’s performance is determined more by its holdings than its costs. Figure 2 shows the mutual funds within each style with the worst holdings or portfolio management ratings. The styles are listed in descending order by overall rating as detailed in my 2Q Style Rankings report.
Figure 2: Style Mutual Funds with the Worst Holdings
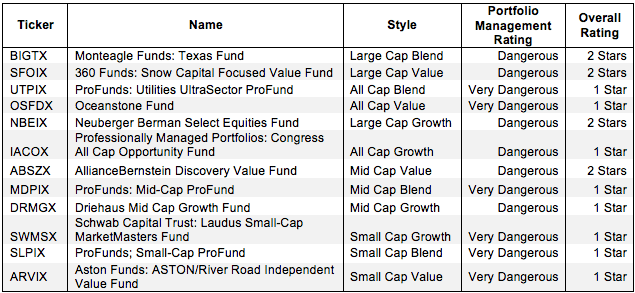 Sources: New Constructs, LLC and company filings
My overall ratings on mutual funds are based primarily on my stock ratings of their holdings. My firm covers over 3000 stocks and is known for the due diligence done on each stock we cover.
ProFunds appears more often than any other provider in Figure 2, which means that they offer the most mutual funds with the worst holdings. Monteagle Funds: Texas Fund (BIGTX) has the worst holdings of all Large Cap Blend mutual funds. SFOIX, OSFDX, ABSZX, and SWMSX all have the worst holdings in their respective styles.
Note that no mutual funds with a Dangerous portfolio management rating earn an overall rating better than two stars. These scores are consistent with my belief that the quality of n mutual fund is more about its holdings than its costs. If the mutual fund’s holdings are dangerous, then the overall rating cannot be better than dangerous because one cannot expect the performance of the mutual fund to be any better than the performance of its holdings.
Figure 2 reveals that one of the cheapest mutual funds, AllianceBernstein (ABSZX) gets my Dangerous rating because its holdings get my Dangerous rating. Similarly, Oceanstone Fund (OSFDX) also one of the cheapest mutual funds, gets a Very Dangerous portfolio management rating and, therefore, cannot earn anything better than a 2-star or Dangerous overall rating. Again, the mutual fund’s overall rating cannot be any better than the rating of its holdings.
Find the mutual funds with the worst overall ratings on my Mutual Fund screener. More analysis of the Best Style Mutual funds is here.
The Danger Within
Buying a mutual fund without analyzing its holdings is like buying a stock without analyzing its business and finances. As Barron’s says, investors should know the Danger Within. Put another way, research on mutual fund holdings is necessary due diligence because a mutual fund’s performance is only as good as its holdings’ performance.
PERFORMANCE OF MUTUAL FUND’s HOLDINGs = PERFORMANCE OF MUTUAL FUND
Best & Worst Stocks In these Mutual Funds
Methode Electronics, Inc. (MEI) is one of my least favorite stocks held by NYSAX and earns my Dangerous rating. Over the past eight years, MEI’s after-tax profit (NOPAT) has declined by 2% compounded annually. At the same time, the company’s return on invested capital (ROIC) has been cut in half from 12% in 2005 to 6% in 2013. Despite the poor fundamentals, MEI’s stock price is up over 100% in the past year, making it overvalued. To justify its current valuation of ~$28/share, MEI would need to grow NOPAT by 15% compounded annually for 56 years. That is an unrealistic expectation for most any company, especially one with the declining profitability of MEI.
Chevron (CVX) is one of my favorite stocks held by FSIOX and earns my Attractive rating. Chevron has grown NOPAT by 16% compounded annually since 2002 and has an ROIC of 9%, which is on par with industry leader Exxon Mobil (XOM). Chevron also has generated positive economic earnings for nine out of the past ten years. Despite these strong fundamentals and history of profit growth, CVX is still trading at just ~$125/share. This price gives CVX a price to economic book value (PEBV) ratio of 1.3, which implies that the market expects the company to grow NOPAT by only 30% for the remaining life of the company. In looking at CVX’s competitive position and excellent NOPAT growth over the past decade, these expectations seem too low. CVX offers investors great risk/reward.
Kyle Guske II contributed to this article
Disclosure: David Trainer and Kyle Guske II receive no compensation to write about any specific stock, sector, or theme.