Note to non-subscribers: We are no longer offering all of our reports for free. You may have noticed that many of the top experts in the financial sector value our reports quite highly. Barron’s has featured our best-in-market research seven times this year already as have USA Today, CNBC, MarketWatch.com, The Motley Fool, The Wall Street Journal, Abnormal Returns, Fox Business and the list goes on. Chuck Jaffe of MarketWatch listed our ratings as one of the three he looks at when picking a mutual fund or ETF. The other two: Morningstar and Lipper.
We are offering this report for free for the 3Q14 Best and Worst ETFs and Mutual Funds series. However, most of our reports, which include detailed analysis of all 10 sectors and 12 fund styles, will be available to subscribers only. We will be updating all the sector reports and all the style reports from last quarter. For a limited time, you can get access to all our reports for just $9.99/month.
This report identifies the “best” ETFs and mutual funds based on the quality of their holdings and their costs. As detailed in “Cheap Funds Dupe Investors”, there are few funds that have both good holdings and low costs. While there are lots of cheap funds, there are very few with high-quality holdings.
Without speculating on the cause for this disconnect, I think it is fair to say that there is a severe lack of quality research into the holdings of mutual funds and ETFs. There should not be such a large gap between the quality of research on stocks and funds, which are simply groups of stocks.
After all, investors should care more about the quality of a fund’s holdings than its costs because the quality of a fund’s holdings is the single most important factor in determining its future performance.
My Predictive Rating system rates 7200+ mutual funds and ETFs according to the quality of their holdings (portfolio management rating), their costs (total annual costs rating), and the fund’s rank relative to all the ETFs and mutual funds I cover.
The following is a summary of my top picks and pans for all style ETFs and mutual funds. I will follow this summary with a detailed report on each style, just as I did for each sector.
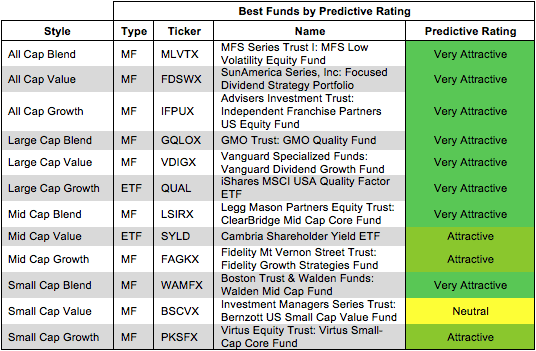
Figure 1 shows the best ETF or mutual fund in each investment style as of July 21, 2014. Investors have an Attractive-or-better option in all sectors besides Small Cap Value.
For a full list of all ETFs and mutual funds for each investment style ranked from best to worst, see our free ETF and mutual fund screener.
Figure 1: Best ETFs and Mutual Funds In Each Style
 Source: New Constructs, LLC and company filings
Vanguard Specialized Funds: Vanguard Dividend Growth Fund (VDIGX) is my top rated Large Cap Value fund and the number one rated mutual fund out of all the style ETFs and mutual funds I cover. VDIGX allocates over 25% of its assets to Attractive-or-better rated stocks and its total annual costs are only 0.36%.
Everest Re Group, Ltd. (RE) is one of my favorite stocks held by MLVTX and makes it onto my Most Attractive Stocks list for July. Over the past four years, RE has grown after-tax profit (NOPAT) by 15% compounded annually. The company currently earns a return on invested capital (ROIC) of 18%, placing it in the top quintile of all 3,000 companies I cover. Depsite this impressive profit growth, RE is priced for a significant downturn. At its current price of ~$162/share, RE has a price to economic book value (PEBV) ratio of 0.5. This ratio implies the market expects RE’s NOPAT to permanently decline 50% from today’s value. Even if RE cannot sustain its high level of profitability, it seems unlikely that such a drastic decline will take place. Quality earnings combined with a cheap valuation make RE one of my Most Attractive stocks.
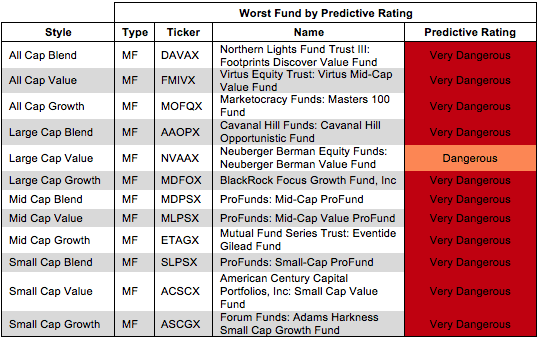
Figure 2 shows the worst ETF or mutual fund for each investment style as of July 21, 2014. Take note that only the Large Cap Value style does not contain a Very Dangerous fund.
Dangerous-or-worse-rated funds have a combination of low-quality portfolios (i.e. they hold too many Dangerous-or-worse rated stocks) and high costs (they charge investors too much for the [lack of] management they provide).
Figure 2: Worst ETFs and Mutual Funds In Each Style
 Source: New Constructs, LLC and company filings
BlackRock Focus Growth Fund, Inc (MDFOX) is my worst rated Large Cap Growth fund and worst rated fund out of all stytle ETFs and mutual funds I cover. MDFOX allocates 3% of its assets to Attractive-or-better stock while stil charging total annual costs of 4.24%. There are thousands of other funsd out there with even marginally better portfolios that will charge investors less.
Ashland Inc. (ASH) is one of my least favorite stocks held by MLPSX and earns my Very Dangerous rating. Over the past eight years, ASH’s NOPAT has declined by 2% compounded annually. In 2013, ASH earned a bottom quintile ROIC of 5%. As I discussed in January, actuarial gains on their pension plan artificially inflated ASH’s earnings. Possibly due to these artificially high earnings, ASH remains priced as a profit growing company. To justify the current price of ~$107/share, ASH must grow NOPAT by 10% compounded annually for the next 43 years. Not many companies can grow that consistently for that long. Overly optimisitc expectations and declining profits make ASH one to avoid.
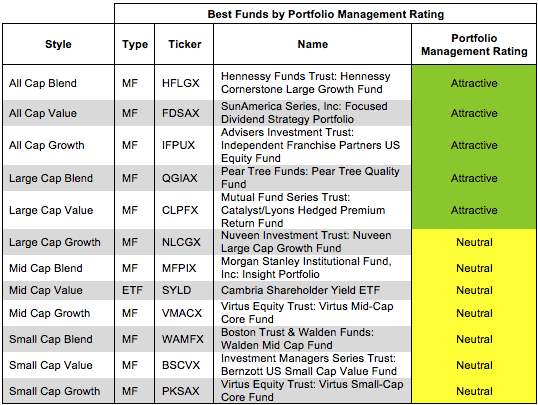
Traditional mutual fund research has focused on past performance and low management costs. The quality of a fund’s holdings has been ignored. Our Portfolio Management ratingexamines the fund’s holdings in detail and takes into account the fund’s allocation to cash. Our models are created with data from over 40,000 annual reports. This kind of diligence is necessary for understanding just what you are buying when you invest in a mutual fund or an ETF.
Figure 3 shows the best fund based on our Portfolio Management rating for each investment style as of July 21, 2014.
Attractive-or-better-rated funds own high-quality stocks and hold very little of the fund’s assets in cash – investors looking to hold cash can do so themselves without paying management fees. Only 30% of funds receive our Attractive or Very Attractive Portfolio Management ratings, so investors need to be cautious when selecting a mutual fund or ETF – there are thousands of Neutral-or-worse-rated funds.
Figure 3: Style Funds With Highest Quality Holdings
 Source: New Constructs, LLC and company filings
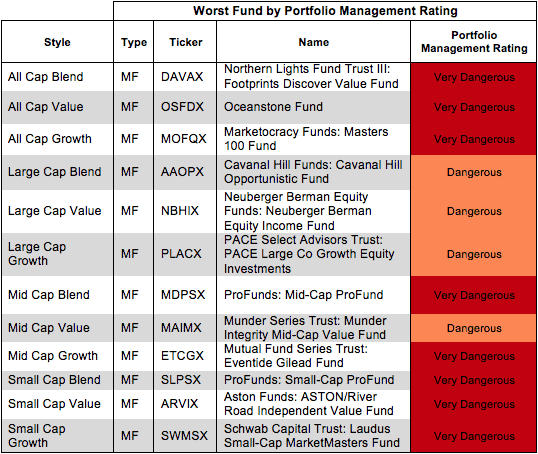
Figure 4 shows the worst fund based on our Portfolio Management rating for each investment style as of July 21, 2014.
Investors pay mutual fund managers to pick stocks for them. Even ignoring costs, these mutual fund managers do a poor job investing money for their clients.
Figure 4: Style Funds With Lowest Quality Holdings
 Source: New Constructs, LLC and company filings
Investors should care about all of the fees associated with a fund in addition to the quality of the fund’s holdings. The best funds have both low costs and quality holdings – and there are plenty of low cost funds available to investors.
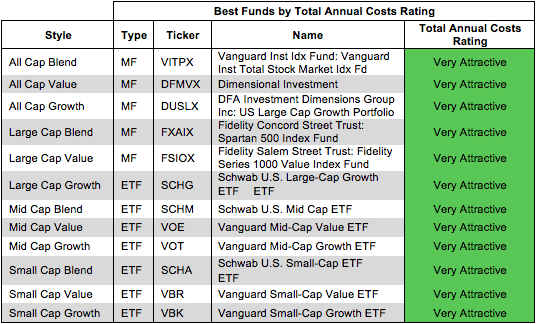
Figure 5 shows the best fund in each investment style according to our Total Annual Costs rating. An ETF ranks as the lowest cost for seven of the twelve style categories.
Total Annual Costs incorporates all expenses, loads, fees, and transaction costs into a single value that is comparable across all funds. Passively managed ETFs and index mutual funds are generally the cheapest funds.
Figure 5: Style Funds With Lowest Costs
 Source: New Constructs, LLC and company filings
The most expensive fund for each investment style has a Very Dangerous Total Annual Costs rating. Investors should avoid these funds and other funds with a Very Dangerous Total Annual Costs ratings because they charge investors too much. For every fund with a Very Dangerous Total Annual Costs rating there is an alternative fund that offers similar exposure and holdings at a lower cost. We cover over 6800 mutual funds and over 400 ETFs. Investors have plenty of alternatives to these overpriced funds.
Figure 6 shows the worst fund in each investment style according to our Total Annual Costs rating. No ETFs ranks as the most expensive for any style category.
Figure 6: Style Funds With Highest Costs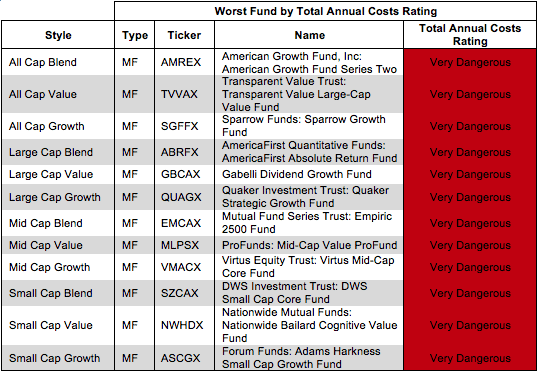 Source: New Constructs, LLC and company filings
Kyle Guske II contributed to this report.
Disclosure: David Trainer and Kyle Guske II receive no compensation to write about any specific stock, sector or theme.