
Our forward-looking ETF and mutual fund ratings provide diligence on ETFs and mutual funds that is rarely found on individual stocks. Through this work, we can discern which ETFs and mutual funds are the best in breed.
We’ve been bullish on certain Energy stocks for quite some time and this week’s Long Idea is a Very Attractive-rated Energy ETF that maximizes allocation to good stocks in the sector, minimizes allocation to bad stocks, and taps into larger macro tailwinds.
Below, we provide an excerpt from our latest Long Idea report. Get the full report a la carte here.
This ETF Provides Better Risk/Reward Than the Market
This ETF tracks a subset of the Energy sector and holds highly profitable and attractively valued companies.
Figure 2 in the full report shows our detailed rating for the ETF, which includes each of the criteria we use to rate all ETFs and mutual funds under coverage. These criteria are the same for our Stock Rating Methodology, because the performance of an ETF’s holdings drives the performance of the ETF after fees. Figure 2 also compares the ETF’s rating with those of IWS, SPY, and IWM.
This ETF’s holdings are superior or equal to SPY in four of the five criteria that make up our Portfolio Management Rating. Specifically:
- The ETF’s holdings generate positive economic earnings, same as SPY.
- The ETF’s ROIC is 8%, which is lower than SPY’s at 35%.
- The ETF’s 2-yr avg FCF yield of 1% is equal to SPY.
- The PEBV ratio for the ETF’s holdings is 1.8, which is much lower (better) than SPY’s at 3.8.
- Our discounted cash flow analysis reveals an average market-implied GAP of just six years for the ETF’s holdings compared to 67 years for SPY.
The takeaway?
This ETF allocates to profitable businesses, as measured by positive economic earnings and an 8% ROIC, which trade at much cheaper prices than the stocks in the S&P 500.
This ETF Is Better than the Energy Sector, Too
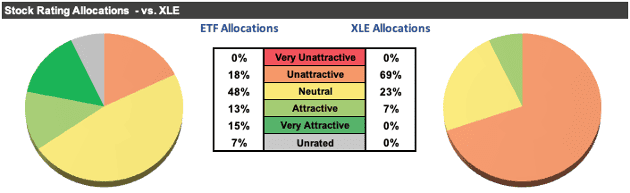
Our analysis reveals that this ETF allocates more capital to profitable companies with cheaper valuations than State Street Energy Select Sector SPDR ETF (XLE) as well. XLE earns our Unattractive rating.
Per Figure 3, the ETF allocates 28% of its assets to Attractive-or-better rated stocks compared to just 7% for XLE. The ETF allocates 76% of its assets to Neutral-or-better rated stocks compared to just 30% for XLE. It allocates just 18% of its assets to Unattractive-or-worse rated stocks compared to 69% for XLE.
Figure 3: This ETF’s Holdings Are Superior to XLE
Sources: New Constructs, LLC and company filings
Below Average Costs for Superior Holdings
Below average fees for superior holdings make this ETF even more attractive in any market.
This ETF’s 0.50% total annual costs (TAC) are below the 2.28% simple average of the Energy ETFs and mutual funds for which we have assets data under coverage. The ETF’s TAC are also below the 0.64% asset-weighted average.
Figure 6 in the full report shows our breakdown of the ETF’s total annual costs, which is available for all 7,000+ mutual funds and ETFs under coverage.
…there’s much more in the full report. You can buy the report a la carte here.
Or, become a Professional or Institutional member – they get all Long Idea reports.
Interested in starting your membership to get access to more of our research? Get more details here.