
In our 3Q20 analysis of the S&P 500’s true Core Earnings[1], we noted the rapid decline in profitability had not deterred the index’s valuation from racing to all-time highs. That trend remains unchanged. The S&P 500 clearly expects record economic growth to translate into record earnings growth.
In this report, our Core Earnings research is based on the latest audited financial data, which is the 2020 10-K for most companies. Operating Earnings from S&P Global is based on the same time frame.
S&P 500 Pricing In Major Earnings Recovery
Figure 1 shows how the S&P 500 price continues to rise in the face of a stark decline in Core Earnings.
Figure 1 also illustrates how different the market’s response to the COVID-19 pandemic has been compared to the Financial Crisis in 2008/2009. During that crisis, the S&P 500’s price fell with Core Earnings and didn’t rebound until 2Q09, around the time Core Earnings bottomed. Today, the market has already soared to all-time highs while Core Earnings remain depressed.
We continue to see positive news regarding the vaccine rollout and the “reopening” of economies around the world. The good news and expectations for earnings growth appear priced in to most stocks, and we think investors with fiduciary duties should consider taking some gains and reallocating to more undervalued and safer stocks.
Figure 1: Core Earnings vs. S&P 500 Price: 2004 to Present (through 3/23/21[2])
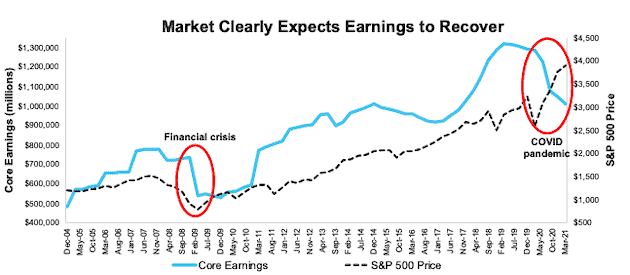
Sources: New Constructs, LLC, company filings, and S&P Global (SPGI).
Our Core Earnings analysis is based on aggregated TTM data through 6/30/13, and aggregated quarterly data thereafter for the S&P 500 constituents in each measurement period. More details in Appendix I.
S&P 500 Hasn’t Been This Expensive Since 2004
Figure 2 shows how the trailing price-to-earnings (P/E) ratios based on our Core Earnings and S&P Global’s (SPGI) operating earnings are currently at all-time highs (data goes back to 2004), breaking records previously set in 3Q20. Both ratios clearly indicate that the market is fully valuing a significant recovery in earnings.
Figure 2: Price-to-Core vs. Price-to-SPGI’s Operating Earnings: TTM 12/31/04 – Present (through 3/23/21)
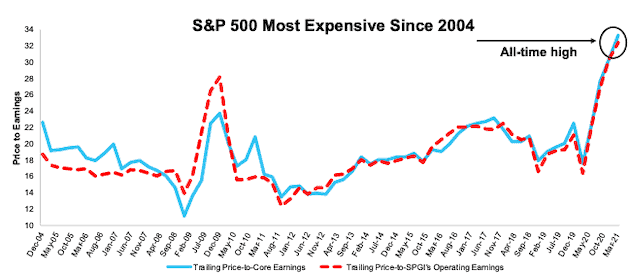
Sources: New Constructs, LLC, company filings, and S&P Global.
Our Core Earnings P/E ratio is aggregating the TTM results for constituents through 6/30/13 and aggregating four quarters of results for the S&P 500 constituents in each measurement period thereafter. SPGI’s P/E is based on four quarters of aggregated S&P 500 results in each period. More details in Appendix II.
The Earnings Rebound Has Not Arrived
2020 Core Earnings per share for the S&P 500 fell 4% quarter-over-quarter while 2020 S&P Global's Operating Earnings per share[3] for the S&P 500 fell 2%. Despite the strong price performance of the S&P 500 in 2020, the subsequent earnings recovery had not yet materialized by the end of 2020.
Figure 3 highlights how different our measure of Core Earnings has been from SPGI’s Operating Earnings in prior periods. The differences are due to errors, omissions, and biases in legacy fundamental datasets (detailed in a paper forthcoming in The Journal of Financial Economics) that fail to capture the full impact of unusual gains/losses buried in footnotes. Missing these unusual gains/losses causes earnings measures to be unreliable and subject to management manipulation.
Relying on legacy providers’ data can put investors at risk of not understanding the true trajectory of earnings at a company level and across the entire market.
Figure 3: Core Earnings vs. SPGI’s Operating Earnings Per Share: 2004 – Present (through 3/23/21)
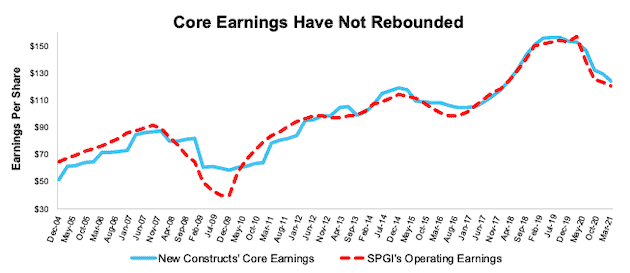
Sources: New Constructs, LLC, company filings, and S&P Global. Note: the most recent periods’ data for SPGI’s Operating Earnings is based on consensus.
Our Core Earnings analysis is based on aggregated TTM data through 6/30/13, and aggregated quarterly data thereafter for the S&P 500 constituents in each measurement period.
Figure 4 charts the percentage change in our Core Earnings and SPGI’s operating earnings and clearly illustrates that SPGI’s operating earnings took a more pronounced decline during the financial crisis and have yet to align with Core Earnings.
Figure 4: Core vs. SPGI’s Operating Earnings Per Share for the S&P 500 – % Change: 2004 – 3/23/21
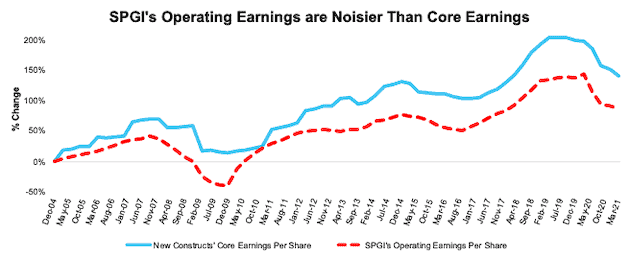
Sources: New Constructs, LLC, company filings, and S&P Global (SPGI). Note: the most recent periods’ data for SPGI’s Operating Earnings is based on consensus.
Our Core Earnings analysis is based on aggregated TTM data through 6/30/13, and aggregated quarterly data thereafter for the S&P 500 constituents in each measurement period.
Where & Where Not to Put Your Money
We’ve recently identified numerous “Micro-Bubbles” or groups of stocks with extraordinary levels of risk compared to peer firm’s stocks. Micro-Bubble winners are undervalued stocks of companies positioned to excel during and after the stocks in Micro-Bubbles burst, and investors can find quality risk/reward in these names. On the flip side investors should avoid Micro-Bubble losers, which are stocks of companies that are priced for unrealistic growth in profitability and market share despite weak fundamentals and often a lack of competitive advantage.
Figure 5 shows all of our micro-bubble winners and losers.
Figure 5: Micro-Bubble Winners & Micro-Bubble Stocks
| Micro-Bubble Winners | Micro-Bubble Losers | Report Date |
| The Walt Disney Company (DIS) | Netflix (NFLX) | 3/24/21 |
| JPMorgan Chase (JPM) | No one specific loser | 3/10/21 |
| No one specific winner | Spotify Technology (SPOT) | 3/1/21 |
| General Motors Co (GM) | Tesla Inc (TSLA) | 2/18/21 |
| Kellogg Company (K) | Beyond Meat Inc. (BYND) | 2/16/21 |
| Hyatt Hotels Corp (H) | Airbnb, Inc. (ABNB) | 2/10/21 |
| Williams-Sonoma Inc. (WSM) | Wayfair, Inc. (W) | 2/3/21 |
| Sysco Corporation (SYY) | DoorDash, Inc. (DASH) | 1/27/21 |
| Alphabet, Inc. (GOOGL) | GoDaddy Inc (GDDY) | 9/26/18 |
| Microsoft Corporation (MSFT) | Dropbox Inc. (DBX) | 9/26/18 |
| Oracle Corporation (ORCL) | Salesforce.com Inc. (CRM) | 8/16/18 |
| Walmart, Inc. (WMT) | Amazon.com Inc. (AMZN) | 8/16/18 |
Sources: New Constructs, LLC and company filings.
This article originally published on April 13, 2021.
Disclosure: David Trainer owns SYY, H, and JPM. David Trainer, Kyle Guske II, Matt Shuler, Alex Sword, and Devyn DeLange receive no compensation to write about any specific stock, style, or theme.
Follow us on Twitter, Facebook, LinkedIn, and StockTwits for real-time alerts on all our research.
Appendix I: Core Earnings Methodology
In the Figures above, we use the following to calculate Core Earnings:
- aggregated annual data for constituents in the S&P 500 for each measurement period through 6/30/13
- aggregated quarterly data for constituents in the S&P 500 for each measurement period post 6/30/13 to present
While we prefer aggregated quarterly numbers, we have examined the potential impacts of the two methodologies and have found no material differences.
Appendix II: P/E Ratio Methodology for Core & SPGI’s Operating Earnings
In Figure 2 above, we calculate the price-to-Core Earnings ratio through 6/30/13 as follows:
- Calculate a TTM earnings yield for every S&P 500 constituent
- Weight the earnings yields by each stock’s respective S&P 500 weight
- Sum the weighted earnings yields and take the inverse (1/Earnings Yield)
We calculate the price-to-Core Earnings ratio for periods post 6/30/13 as follows:
- Calculate a trailing four quarters earnings yield for every S&P 500 constituent
- Weight the earnings yield by each stock’s respective S&P 500 weight
- Sum the weighted earnings yields and take the inverse (1/Earnings Yield)
We use the earnings yield methodology because P/E ratios don’t follow a linear trend. A P/E ratio of 1 is “better” than a P/E ratio of 30, but a P/E ratio of 30 is “better” than a P/E ratio of -15. In other words, aggregating P/E ratios can result in a low multiple due the inclusion of just a few stocks with negative P/Es.
Using earnings yields solves this problem because a high earnings yield is always “better” than a low earnings yield. There is no conceptual difference when flipping from positive to negative earnings yields as there is with traditional P/E ratios.
By using quarterly data as soon as its available, we better capture the impact of changes to S&P 500 constituents on a quarterly basis. For example, a company could be a constituent in 2Q18, but not in 3Q18. This method captures the continuously changing nature of the S&P 500 constituency.
For all periods in Figure 2, we calculate the price-to-SPGI’s Operating Earnings ratio by summing the preceding 4 quarters of Operating Earnings per share and, then, dividing by the S&P 500 price at the end of each measurement period.
[1] Only Core Earnings enable investors to overcome the inaccuracies, omissions and biases in legacy fundamental data and research, as proven in Core Earnings: New Data & Evidence, a forthcoming paper in The Journal of Financial Economics.
[2] The earliest date 2020 10-Ks for the S&P 500 constituents were available.
[3] We think SPGI’s Operating Earnings provide the best comparison to how we calculate Core Earnings.