We published an update on WSM on October 12, 2023. A copy of the associated report is here.
We published an update on W on February 7, 2022. A copy of the associated update report is here.
Would investors rather own a cash-burning firm with high expectations for future cash flow growth, or a cash-generating firm with low expectations? We believe there’s better risk/reward in the latter. This week’s Long Idea is micro-bubble winner Williams-Sonoma Inc. (WSM: $126/share), which we pair with a sell idea, micro-bubble loser Wayfair, Inc. (W: $285/share).
“Micro-Bubbles” are groups of stocks with extraordinary risk compared to other stocks within the overall market. Micro-bubble winners are undervalued stocks of companies positioned to excel during and after the stocks in micro-bubbles burst. In August 2018 and September 2018, we paired six micro-bubble loser stocks with six micro-bubble winners. We added another pair to this group in January 2021.
New Micro-Bubble Winner: Williams-Sonoma (WSM) vs. New Micro-Bubble Loser: Wayfair, Inc. (W)
Our last report on Williams-Sonoma’s (WSM) was in February 2020. Since then, the stock climbed 72% versus a 13% gain for the S&P 500. We last wrote on Wayfair, Inc. (W) in August 2020. Since then, the stock is down 7% versus a 13% gain for the S&P 500. Even after its stock’s relative outperformance, Williams-Sonoma provides much better risk/risk reward than Wayfair.
Williams-Sonoma Has Much Better Cash Flows…
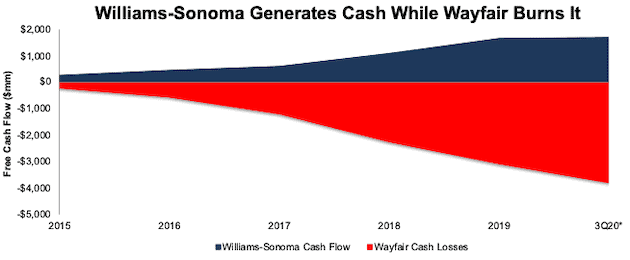
The old adage says, “cash is king,” and we prefer stocks in firms that consistently generate cash over those that burn cash. Over the past five years[1], Williams-Sonoma generated a cumulative $1.6 billion (17% of market cap) in free cash flow (FCF) while Wayfair burned $3.1 billion (11% of market cap) in FCF over the same time. Over the TTM, Williams-Sonoma generated $361 million in FCF and Wayfair burned -$771 million. Figure 1 shows the cumulative FCF for each firm over the past five years.
Figure 1: Williams-Sonoma vs. Wayfair: Five-Year Cumulative Free Cash Flow
Sources: New Constructs, LLC and company filings.
*3Q20 refers to each firm’s respective fiscal 3Q20. William’s Sonoma’s fiscal 3Q20 ended November 1, 2020. Wayfair’s fiscal 3Q20 ended September 30, 2020.
…and Lower Expectations for Future Cash Flows, Too
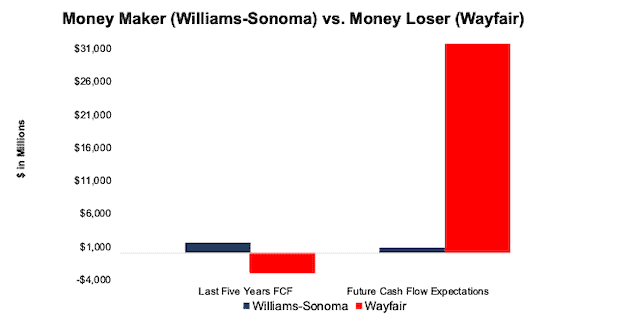
We prefer stocks with low expectations for the companies’ future cash flows over those with overly optimistic future growth expectations. Figure 2 compares the current FCF to the future FCF expectations[2] for Williams-Sonoma and Wayfair. Despite never generating positive free cash flow in the past six years, Wayfair’s stock price reflects expectations for future cash flows that are drastically higher than the future FCF baked into Williams-Sonoma’s valuation.
Figure 2: Williams-Sonoma vs. Wayfair: Cash Flow Growth Expectations vs. Historical Cash Flows
Sources: New Constructs, LLC and company filings.
Expectations for Wayfair’s Future Revenue Are Too High
We use our reverse discounted cash flow (DCF) model to further analyze the future revenue and profit growth expectations baked into Williams-Sonoma’s and Wayfair’s current stock prices.
To justify its current price of $126/share, Williams-Sonoma must maintain a net operating profit after-tax (NOPAT) margin of 8% (vs. 9.5% TTM) and grow revenue by 4% compounded annually over the next eight years. For reference, Allied Market Research expects the U.S. Home Décor Market to grow by 8% compounded annually from 2020 through 2027. See the math behind this reverse DCF scenario.
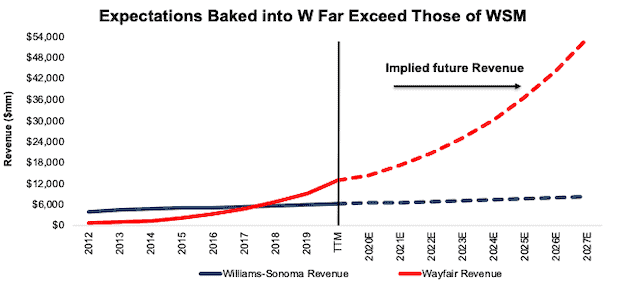
Market expectations for Wayfair’s revenue and profit growth are much higher. To justify its current price of $285/share, Wayfair must immediately achieve a NOPAT margin of 6% (equal to Amazon’s TTM margin) and grow revenue by 25% compounded annually for the next eight years. In this scenario, Wayfair’s revenue in eight years is $53.4 billion, or over eight times greater than Williams-Sonoma’s TTM revenue and five times greater than eBay’s TTM revenue. See the math behind this reverse DCF scenario.
Figure 3[3] compares Williams-Sonoma’s and Wayfair’s implied revenue in this scenario to their historical revenue.
Figure 3: Williams-Sonoma vs. Wayfair: Revenue Growth Expectations vs. Historical Revenue
Sources: New Constructs, LLC and company filings.
Significant Upside Potential Owning WSM
While owning W is riskier relative to WSM, the upside potential in WSM also provides great reward. If we assume Williams-Sonoma can maintain a 9.5% NOPAT margin (equal to TTM) and grow revenue by 5% compounded annually (equal to consensus for fiscal 2020-2025 and 5% a year each year thereafter), the stock is worth $164/share today – a 30% upside to the current price. See the math behind this reverse DCF scenario.
Secular Tailwinds Will Continue After the Pandemic…
As people spent less money eating out and more time at home as the COVID-19 lockdowns spread across the globe, both Williams-Sonoma and Wayfair experienced a large rise in e-commerce sales. While such an increase in demand will present both firms with difficult comps going forward, the long-term trends in home décor spending remain strong.
Even as many in the workforce are returning to the office, the work from home (WFH) trend is expected to persist. A recent study from Upwork reveals that by 2025, WFH levels will be 87% higher than pre-pandemic levels. This trend could accelerate as businesses experience less disruption over time as they adjust to WFH.
Additionally, homeownership rates in the U.S. have trended higher over the past five years. In 4Q16, the homeownership rate in the U.S. was 63.7% and rose to 65.8% in 4Q20.
More people working from home and more people owning homes ultimately leads to increased spending on home décor.
…And Williams-Sonoma Is Better-Positioned to Take Advantage
Williams-Sonoma operates eight different concepts under eight different brands, which allows the firm to target a wider range of demographics, styles, and price points. While Williams-Sonoma has a bigger net to attract a wider audience, it also implements cross-brand initiatives that help maximize cross selling opportunities.
Even though Wayfair greatly benefited from the increase of e-commerce throughout the pandemic, Williams-Sonoma offers customers more options for accessing their products. With in-store purchasing, online purchasing with in-store pickup, and online purchasing with delivery, customers are free to shop how they like at Williams-Sonoma. Additionally, Williams-Sonoma’s brick-and-mortar presence allows consumers the ability to see and feel items before purchase and helps showcase the firm’s brands and products, regardless of which channel customers use to complete the purchase.
Williams-Sonoma Has a Scale Advantage Over Wayfair
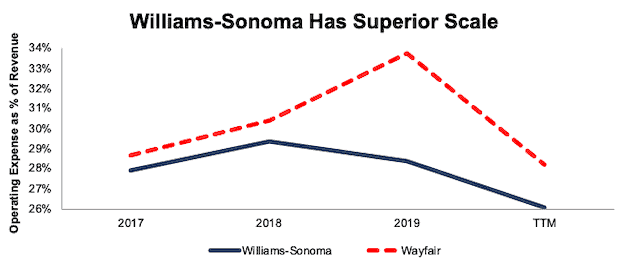
Wayfair has quickly grown revenue, but it has not achieved the scale needed to generate profits. On the other hand, Williams-Sonoma’s 19% ROIC (see Figure 5) showcases the scale and attendant profitability advantages it has over Wayfair. Figure 4 shows that over the past three years, Williams-Sonoma’s total operating costs as a percent of revenue are declining and lower than Wayfair’s. In other words, Williams-Sonoma’s business operations are more efficient, an advantage that the firm can leverage to grow market share and profits.
Figure 4: Williams-Sonoma vs. Wayfair: Operating Expense as % of Revenue[4]
Sources: New Constructs, LLC and company filings.
Williams-Sonoma’s Profitability Bests Wayfair’s, Too
Williams-Sonoma scale advantage translates to increased profitably versus Wayfair as well. In an environment with record demand for home goods, Wayfair just managed to breakeven and generate $5 million in NOPAT with a NOPAT margin of <1%. Meanwhile, Williams-Sonoma generated $603 million in NOPAT over the TTM with a NOPAT margin of 9.5%. Per Figure 5, Williams-Sonoma earns a significantly higher return on invested capital (ROIC) than Wayfair and is undervalued when measured by price-to-economic book value (PEBV) ratio.
Figure 5: Williams-Sonoma vs. Wayfair: Fundamental Metrics Comparison
Sources: New Constructs, LLC and company filings.
Williams-Sonoma’s Executive Compensation Plan Is Better, Too
Not only is Williams-Sonoma more profitable, well positioned to benefit from industry growth, and undervalued relative to Wayfair, its corporate governance is better too. We prefer firms tie executive compensation to improving ROIC, as there is a strong correlation between improving ROIC and increasing shareholder value, and Williams-Sonoma does just that.
Williams-Sonoma links executives’ performance-based RSUs to a three-year average ROIC target. Conversely, Wayfair’s executive compensation plan creates additional risk for shareholders. Wayfair Executives’ RSUs are tied to the performance of the firm’s stock. Given the contrast in incentives, it’s no accident that Williams-Sonoma earns a superior ROIC.
We’ve previously covered the problems with aligning executives’ compensation with stock price, which include incentivizing a focus on top-line growth with no accountability to create shareholder value.
Such a disconnect further reveals itself in the firms’ respective economic earnings, or the true cash flows of the business. Over the past five years, Williams-Sonoma generated a cumulative $904 million in economic earnings while Wayfair generated a cumulative -$2.2 billion in economic earnings.
Keep These Winners & Sell These Losers
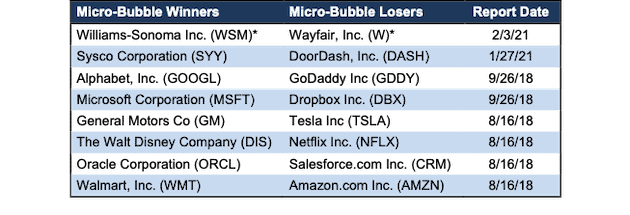
Williams-Sonoma and Wayfair aren’t the only micro-bubble winners and losers. We believe the micro-bubble winners will outperform micro-bubble losers going forward, especially because the expectations implied by the micro-bubble winner’s valuations are much less than those of the micro-bubble losers. Figure 6 lists all of our micro-bubble winners and micro-bubble losers.
Figure 6: Micro-Bubble Winners & Micro-Bubble Stocks
Sources: New Constructs, LLC and company filings.
*New to the list as of this report.
This article originally published on February 3, 2021.
Disclosure: David Trainer, Kyle Guske II, and Matt Shuler receive no compensation to write about any specific stock, style, or theme.
Follow us on Twitter, Facebook, LinkedIn, and StockTwits for real-time alerts on all our research.
[1] Williams-Sonoma’s last fiscal year was from February 4, 2019 to February 2, 2020. The firm refers to this as fiscal 2019. Wayfair’s last fiscal year was from January 1, 2019 to December 31, 2019. The firm refers to this as fiscal 2019. The dates shown in Figure 1 reflect each firm’s fiscal year.
[2] Future cash flow expectations (aka “PVGO”) throughout this report equal the incremental present value of growth in future cash flows required to justify a stock price. The calculation is market value minus economic book value.
[3] Williams-Sonoma’s last fiscal year was from February 4, 2019 to February 2, 2020. The firm refers to this as fiscal 2019. Wayfair’s last fiscal year was from January 1, 2019 to December 31, 2019. The firm refers to this as fiscal 2019. The dates given here and shown in Figure 3 reflect each firm’s fiscal year.
[4] Williams-Sonoma’s last fiscal year was from February 4, 2019 to February 2, 2020. The firm refers to this as fiscal 2019. Wayfair’s last fiscal year was from January 1, 2019 to December 31, 2019. The firm refers to this as fiscal 2019. The dates shown in this chart reflect each firm’s fiscal year.

