
We first made D.R. Horton (DHI: $154/share) a Long Idea in April 2020 and most recently reiterated our thesis on the stock in January 2025. See all reports on DHI here. Since our original report, the stock is up 228% while the S&P 500 is up 142%.
Our thesis highlighted D.R. Horton’s long track record of profits, healthy balance sheet, high return on invested capital (ROIC), and its leadership in addressing the affordability crisis in the U.S. housing market. As we enter 2026, our thesis remains intact and DHI remains undervalued.
DHI offers favorable Risk/Reward based on the company’s:
- leading market share,
- geographic diversification,
- focus on more affordable homes,
- strong capital return and free cash flow (FCF), and
- cheap stock valuation.
What’s Working
The Longtime Industry Leader
D.R. Horton was, for the 24th consecutive year, the largest homebuilder in the U.S. in 2025. The company ranks as a top 5 builder in 92% of its operating markets and the largest builder in 60 markets.
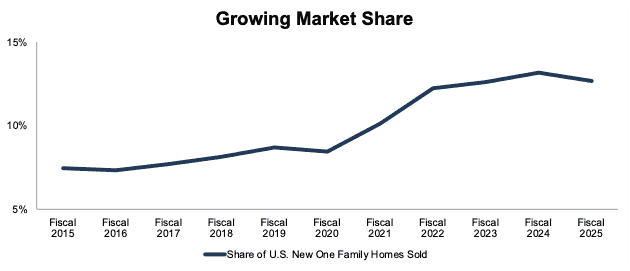
The company’s share of U.S. new one family homes, based on homes closed in each fiscal year, has increased from 7.4% in fiscal 2015 to 12.7% in fiscal 2025. See Figure 1.
Figure 1: D.R. Horton’s Rising Market Share: Fiscal 2015 – Fiscal 2025
Sources: New Constructs, LLC and company filings, and FRED
Over the trailing-twelve-months (TTM) ended September 30, 2025 (D.R. Horton’s fiscal year), nearly one out of every seven new single-family homes in the U.S. were built by D.R. Horton.
Geographically Diversified
D.R. Horton operates in 126 markets across 36 states. The company segments its operations by region, and in calendar 2025, no one region represented more than 26% of the company’s total homes closed. In calendar 2025, homes closed by region are as follows:
- Northwest: 6%
- Southwest: 11%
- South Central: 26%
- Southeast: 24%
- East: 21%
- North: 12%
This geographic diversification mitigates the impact of volatility in home purchases and pricing at the local/regional level. Should one region slow, D.R. Horton can prioritize other regions and capitalize on overall home demand across the country.
Focused on Affordability
As we noted in our recent Long Idea on M/I Homes (MHO), new homes have rarely been this unaffordable.
D.R. Horton aims to help this problem with a focus on cheaper entry-level homes. The company profitably builds homes that are cheaper than the national average. In the quarter ended December 31, 2025, D.R. Horton’s average sales price was 27% below the national average.
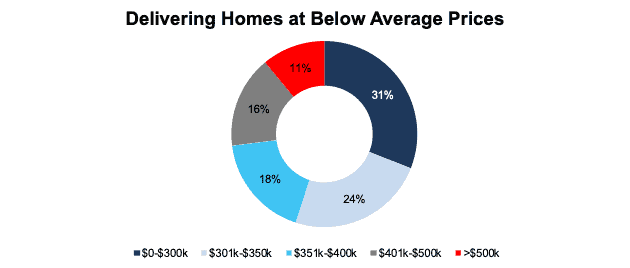
In calendar 2025, 73% of D.R. Horton’s homes closed were priced below $400,000. See Figure 2.
For reference, the average sales price of new homes sold in the U.S. in October 2025 was $498,000.
Figure 2: D.R. Horton’s Homes Closed by Average Home Sales Price: Calendar 2025
Sources: New Constructs, LLC and company presentation
Lots Under Control
Any homebuilder needs land to build communities and sell homes. As D.R. Horton notes, “land and lots are the key to any homebuilder’s future growth.”
As of December 31, 2025, D.R. Horton controls, either through outright ownership or existing purchase contracts, 590,500 lots. D.R. Horton controls the most lots amongst the top 10 volume homebuilders.
The company owns outright 145,500 lots, which falls within the company’s aim to own a 1-2 year supply of lots.
Profits Remain Strong
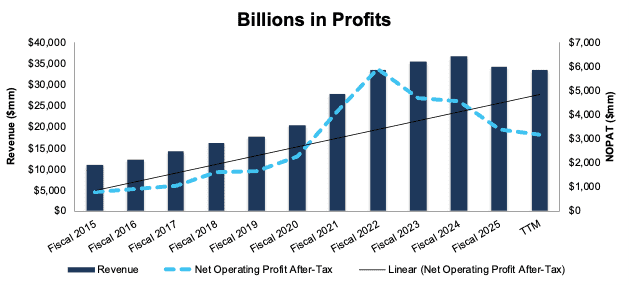
D.R. Horton has grown revenue and net operating profit after-tax (NOPAT) by 12% and 15% compounded annually, respectively, since fiscal 2015. The company’s NOPAT margin improved from 7% in fiscal 2015 to 9% over the TTM, while invested capital turns fell slightly from 1.3 to 1.2 over the same time. Rising NOPAT margins offset the decline in IC turns and drive the company’s ROIC from 9% in fiscal 2015 to 11% over the TTM. See Figure 3.
As can be seen in Figure 3, D.R. Horton’s NOPAT has fallen from its 2022 highs, when the housing market soared in a post-COVID boom. Despite the pull back, D.R. Horton generated $3.1 billion in NOPAT over the TTM, which is higher than any fiscal year prior to 2020.
Figure 3: D.R. Horton’s Revenue and NOPAT: Fiscal 2015 – TTM
Sources: New Constructs, LLC and company filings
Good Mix of Scale and Profitability
With an ample supply of lots and a business model that focuses on more standardized home plans to drive faster build times, D.R. Horton effectively combines both scale and profitability.
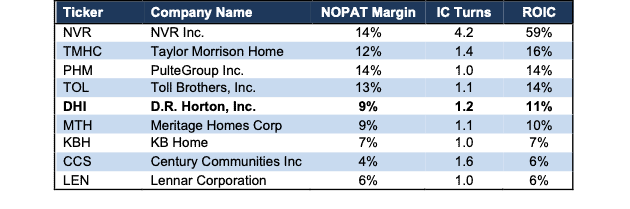
As the largest homebuilder in the U.S., D.R. Horton’s return on invested capital (ROIC) ranks fifth of peers listed in Figure 4. Peers include the publicly traded homebuilders that rank in the top 10 of homes closed, such as NVR Inc. (NVR), PulteGroup (PHM), Toll Brothers (TOL), Meritage Homes (MTH), and more. D.R. Horton’s invested capital turns rank fourth highest amongst peers in Figure 4.
Figure 4: D.R. Horton’s Profitability Vs. Peers – TTM
Sources: New Constructs, LLC and company filings
Significant Cash Flow Generation
Since fiscal 2021, D.R. Horton has generated $9.3 billion (21% of enterprise value) in cumulative free cash flow (FCF). Over the TTM, D.R. Horton generated $3.6 billion in FCF.
Figure 5: D.R. Horton’s Cumulative Free Cash Flow Since Fiscal 2021
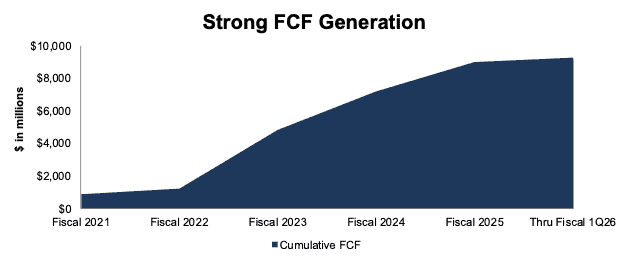
Sources: New Constructs, LLC and company filings
Dividend and Repurchase Yield Could Hit 5%+
Since fiscal 2021, D.R. Horton has paid $2 billion (4.5% of market cap) in cumulative dividends. The company has increased its quarterly dividend from $0.20/share in 1Q21 to $0.45/share in 1Q26. When annualized, the dividend equals $1.80/share and provides investors an 1.2% yield.
While D.R. Horton has consistently increased its dividend, the bulk of capital returned to shareholders comes through share repurchases. From fiscal 2021 through fiscal 1Q26, the company repurchased $9.9 billion (23% of market cap) worth of shares. The company repurchased $4.3 billion worth of shares in fiscal 2025 alone.
In April 2025, D.R. Horton’s Board of Directors authorized a $5 billion share repurchase program with no expiration date. As of December 2025, there is $2.6 billion remaining under the current authorization.
Management reiterated on the fiscal 1Q26 earnings call that it expects to repurchase $2.5 billion worth of stock in fiscal 2026. Subtracting the repurchases from fiscal 1Q26, this guidance implies the company will repurchase an additional $1.8 billion worth of shares in fiscal 2026. A $1.8 billion repurchase is 4.2% of the current market cap, and when combined with the dividend yield, could provide investors a 5.4% yield on shares.
It’s worth noting that with the significant repurchase activity in fiscal 2025, D.R. Horton repurchased more shares than its current FCF could fund. However, substantial cash on the balance sheet enables the company to continue to return large amounts of capital to shareholders.
Reducing Shares Outstanding
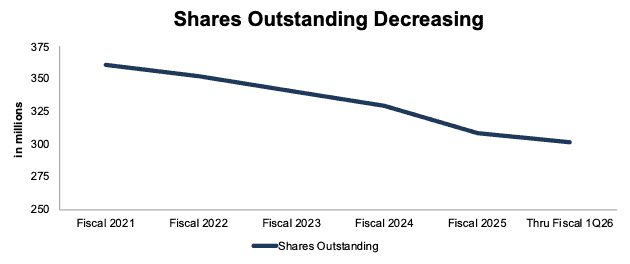
D.R. Horton’s aggressive share buyback activity has meaningfully reduced its shares outstanding from 361 million in fiscal 2021 to 301 million in fiscal 1Q26. See Figure 6.
We like companies that choose to return capital to shareholders instead of spending it on costly acquisitions or executive bonuses that rarely drive shareholder value creation.
Figure 6: D.R. Horton’s Shares Outstanding: Fiscal 2021 – Fiscal 1Q26
Sources: New Constructs, LLC and company filings
Strong Balance Sheet and Credit Rating
D.R. Horton maintains its industry leading position throughout economic cycles in part due to its strong balance sheet.
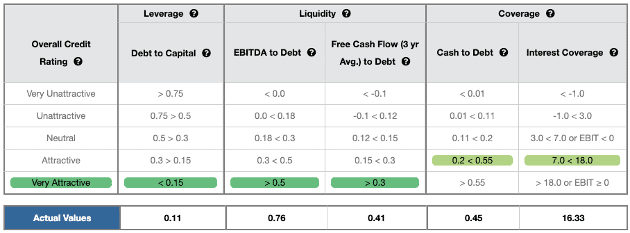
D.R. Horton earns a Very Attractive Overall Credit Rating, which is driven by Very Attractive ratings in the Debt to Capital, EBITDA to Debt, and Free Cash Flow (3 yr Avg.) to Debt metrics that make up our overall Credit Rating.
D.R. Horton also earns an Attractive rating in Cash to Debt and Interest Coverage, the other two metrics that make up our Credit Ratings. Even if economic conditions deteriorate, the company’s strong financial footing secures its operations for the foreseeable future.
Figure 7: D.R. Horton’s Credit Rating Details
Sources: New Constructs, LLC and company filings
What’s Not Working
Mortgage Rates Remain a Drag on Margins
Mortgage rates have risen significantly from the record lows of 2021, when the 30-year fixed rate mortgage (FRM) was around 2.2% and the 15-year FRM was around 2.7%.
As of January 29, 2026, Freddie Mac estimates that the average 30-year fixed-rate mortgage (FRM) sits at 6.1% and the average 15-year FRM sits at 5.5%.
Even though mortgage rates have fallen from late 2023 highs (nearly 8% on a 30-year FRM), they remain a headwind for potential homebuyers.
D.R. Horton’s CEO noted on the fiscal 1Q26 earnings call that the company “increased sales incentives during the first quarter”. Furthermore, he noted that the company expects “incentives to remain elevated in fiscal 2026, with a level dependent upon demand, changes in mortgage rates, and overall market conditions.”
The good news is that D.R. Horton doesn’t need to improve its margins for its stock to hold potential upside. In fact, depressed margins are already price into DHI at its current price, as we’ll show below.
Current Price Implies Profits Hardly Grow
At its current price of $154/share, DHI has a price-to-economic book value (PEBV) ratio of 1.1. This ratio means the market expects the company’s profits to grow just 10% from TTM levels over the remaining life of the company. For context, D.R. Horton has grown NOPAT by 7%, 15%, and 4% compounded annually over the last five, ten, and twenty years, respectively.
Below, we use our reverse discounted cash flow (DCF) model to analyze expectations for different stock price scenarios for DHI.
In the first scenario, we quantify the expectations baked into the current price. If we assume:
- NOPAT margin immediately falls to 8.5% (compared to 9.4% over the TTM and 13.7% average over the past five years) through fiscal 2035,
- revenue grows at consensus rates in fiscal 2026 (-1%) and fiscal 2027 (+6%), and
- revenue grows 2% each year thereafter through fiscal 2035 (compared to 12% compounded annually over the last decade and 4% compounded annually over the last two decades), then
the stock would be worth $152/share today – equal to the current stock price. In this scenario, D.R. Horton’s NOPAT would grow <1% compounded annually from fiscal 2025 through fiscal 2035. Contact us for the math behind this reverse DCF scenario.
Shares Could Go 20%+ Higher
If we instead assume:
- NOPAT margin remains at 9.4% (equal to TTM) through fiscal 2035,
- revenue grows at consensus rates in fiscal 2026 (-1%) and fiscal 2027 (+6%), and
- revenue grows 4% each year thereafter through fiscal 2035 (equal to revenue CAGR over the last two decades), then
the stock would be worth $189/share today – a 22% upside to the current price. In this scenario, D.R. Horton’ NOPAT grows 3% compounded annually from fiscal 2025 through fiscal 2035. Contact us for the math behind this reverse DCF scenario.
Should the company’s NOPAT grow more in line with historical levels, the stock has even more upside.
Figure 8 compares D.R. Horton’s historical NOPAT to the NOPAT implied in each of the above scenarios.
Figure 8: D.R. Horton’s Historical and Implied NOPAT: DCF Valuation Scenarios
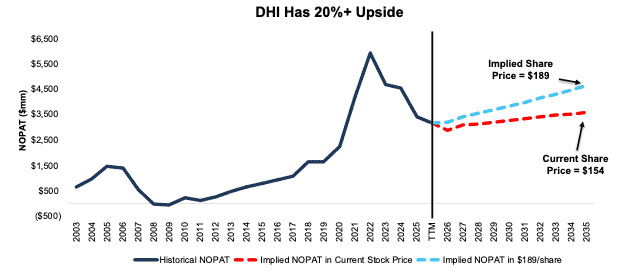
Sources: New Constructs, LLC and company filings
This article was originally published on February 4, 2026.
Disclosure: David Trainer, Kyle Guske II, and Daniel Oliviera receive no compensation to write about any specific stock, sector, style, or theme.
Questions on this report or others? Join our online community and connect with us directly.