The large-cap value style ranks second out of the twelve fund styles as detailed in my Style Rankings for ETFs and Mutual Funds report. It gets my Neutral rating, which is based on aggregation of ratings of 39 ETFs and 728 mutual funds in the large-cap value style as of February 5th, 2013. Prior reports on the best & worst ETFs and mutual funds in every sector and style are here.
Figures 1 and 2 show the five best and worst-rated ETFs and mutual funds in the style. Not all large-cap value style ETFs and mutual funds are created the same. The number of holdings varies widely (from 22 to 1426), which creates drastically different investment implications and ratings. The best ETFs and mutual funds allocate more value to Attractive-or-better-rated stocks than the worst, which allocate too much value to Neutral-or-worse-rated stocks.
To identify the best and avoid the worst ETFs and mutual funds within the large-cap value style, investors need a predictive rating based on (1) stocks ratings of the holdings and (2) the all-in expenses of each ETF and mutual fund. Investors need not rely on backward-looking ratings. My fund rating methodology is detailed here.
Investors seeking exposure to the large-cap value style should buy one of the Attractive-or-better rated ETFs or mutual funds from Figures 1 and 2.
Get my ratings on all ETFs and mutual funds in this style on my free mutual fund and ETF screener.
Figure 1: ETFs with the Best & Worst Ratings – Top 5
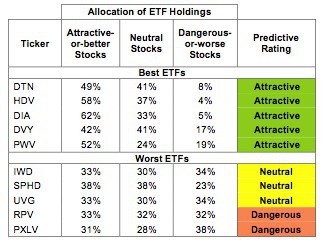 * Best ETFs exclude ETFs with TNAs less than $100 million for inadequate liquidity.
Sources: New Constructs, LLC and company filings
WisdomTree LargeCap Value Fund (EZY) is excluded from Figure 1 because its total net assets (TNA) are below $100 million and do not meet our liquidity standards.
Figure 2: Mutual Funds with the Best & Worst Ratings – Top 5
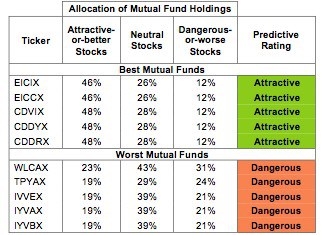 * Best mutual funds exclude funds with TNAs less than $100 million for inadequate liquidity.
Sources: New Constructs, LLC and company filings
Five mutual funds are excluded from Figure 2 because their total net assets (TNA) are below $100 million and do not meet our liquidity standards.
WisdomTree Dividend ex-Financials Fund (DTN) is my top-rated large-cap value ETF and FundVantage Trust: EIC Value Fund (EICIX) is my top-rated large-cap value mutual fund. Both earn my Attractive rating.
PowerShares RAFI Fundamental Pure Large Value Portfolio (PXLV) is my worst-rated large-cap value ETF and Ivy Funds: Ivy Value Fund (IYVBX) is my worst-rated large-cap value mutual fund. Both earn my Dangerous rating.
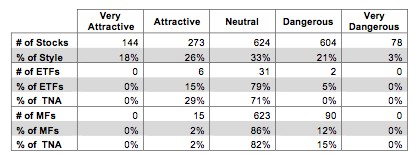
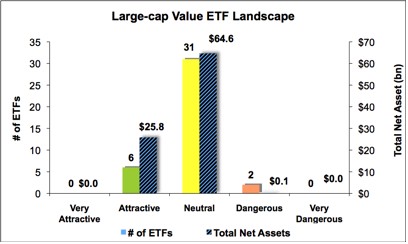
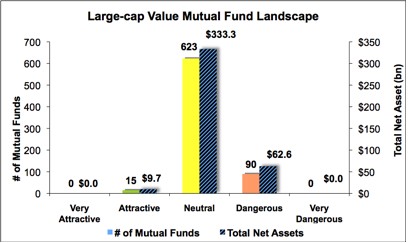
Figure 3 shows that 417 out of the 1723 stocks (over 44% of the assets) in the style get an Attractive-or-better rating. However, only six out of 39 large-cap value ETFs (less than 29% of total net assets) and 15 out of 728 large-cap value mutual funds (less than 2% of total net assets) get an Attractive-or-better rating. It almost seems as if mutual fund managers are trying to avoid the good stocks.
The takeaways are: mutual fund managers allocate too much capital to low-quality stocks and large-cap value ETFs hold poor quality stocks.
Figure 3: Large-cap Value Style Landscape For ETFs, Mutual Funds & Stocks
 Sources: New Constructs, LLC and company filings
As detailed in “Cheap Funds Dupe Investors”, the fund industry offers many cheap funds but very few funds with high-quality stocks, or with what I call good portfolio management.
Investors need to tread carefully when considering large-cap value ETFs and mutual funds, as 84% of ETFs and 98% of mutual funds in the large-cap value style are rated Neutral or worse.. Only six ETFs and 15 mutual funds in the large-cap value style allocate enough value to Attractive-or-better-rated stocks to earn an Attractive rating.
McDonald’s Corporation (MCD) is one of my favorite stocks held by large-cap value ETFs and mutual funds and earns my Very Attractive rating. MCD has grown its after-tax cash flow (NOPAT) by 9% compounded annually since 1998. Its return on invested capital (ROIC) has increased every year since 2002. McDonald’s current share price of ~$94.60 gives it a price to economic book value ratio of 0.9, which means the market is currently predicting a permanent 10% decline in NOPAT for MCD. Such a large decline seems unlikely for a company that has not experienced even a minor decline in NOPAT for a decade.
American International Group, Inc. (AIG) is one of my least favorite stocks held by large-cap value ETFs and mutual funds and earns my Very Dangerous rating. AIG has an ROIC of only 1%, while its weighted average cost of capital (WACC) is 10%, meaning it would need to grow ROIC by over ten times its current level to earn positive economic earnings. Instead ROIC is declining, driven by a 75% decrease in NOPAT last year. In fact, AIG has not earned positive economic earnings since before 1998. AIG’s current share price of ~$38.20 means the market is expecting 20% growth in NOPAT compounded annually over the next 10 years. This expectation seems overly optimistic for a company with a declining NOPAT and no track record of economic profitability.
Figures 4 and 5 show the rating landscape of all large-cap value ETFs and mutual funds.
My Style Rankings For ETFs and Mutual Funds report ranks all styles and highlights those that offer the best investments.
Figure 4: Separating the Best ETFs From the Worst Funds
 Sources: New Constructs, LLC and company filings
Figure 5: Separating the Best Mutual Funds From the Worst Funds
 Sources: New Constructs, LLC and company filings
Review my full list of ratings and rankings along with reports on all 39 ETFs and 728 mutual funds in the large-cap value style.
Sam McBride contributed to this report.
Disclosure: David Trainer owns MCD. David Trainer and Sam McBride receive no compensation to write about any specific stock, sector or theme.