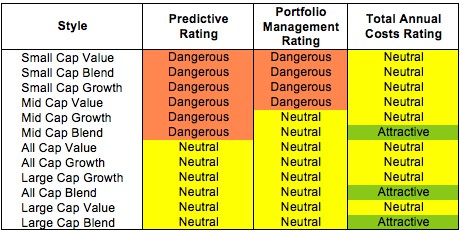
No fund style earns better than a Neutral rating at the beginning of the second quarter of 2013. My style ratings are based on the aggregation of my fund ratings for every ETF and mutual fund in each style.
Investors looking for style funds that hold quality stocks should look no further than the Large Cap Blend, Large Cap Value, Large Cap Growth, All Cap Blend, and All Cap Growth styles. Only these styles house Attractive-or-better rated funds. Figures 6 and 7 provide details. The primary driver behind an Attractive fund rating is good portfolio management, or good stock picking, with low total annual costs.
Note that the Attractive-or-better predictive ratings do not always correlate with Attractive-or-better total annual costs. This fact underscores that (1) low fees can dupe investors and (2) investors should invest only in funds with good stocks and low fees.
See Figures 4 through 13 for a detailed breakdown of ratings distributions by investment style. See my free ETF & mutual fund screener for rankings, ratings and free reports on 7000+ mutual funds and 400+ ETFs. My fund rating methodology is detailed here.
All of my reports on the best & worst ETFs and mutual funds in every sector and investment style are available here.
Figure 1: Ratings For All Investment Styles
 Source: New Constructs, LLC and company filings
To earn an Attractive-or-better Predictive Rating, an ETF or mutual fund must have high-quality holdings and low costs. Only 213 style ETFs and mutual funds meet these requirements, which is only 4% of all style ETFs and mutual funds.
GMO Trust: GMO Quality Fund (GQLOX) is my top Large Cap Blend mutual fund. It gets my Very Attractive rating by allocating nearly 49% of its value to Attractive-or-better-rated stocks. For the vast majority of investors who cannot afford the $300 million initial minimum of GQLOX, GQETX provides the same holdings with slightly higher costs with no initial minimum.
Oracle Corp (ORCL) is one of my favorite stocks held by GQLOX. Oracle is one of the most consistent companies in the dynamic tech industry. Over the past 14 years it has never had a return on invested capital (ROIC) below 20%, a level most companies can only dream of. It has not experienced a year of declining after tax profit (NOPAT) in a decade. While some analysts fear that the shift to cloud computing is disrupting ORCL’s business, they miss the potential upside. If Oracle successfully adapts to the cloud and becomes a major cloud storage player—and its resources and track record suggest it will—the cloud could contribute to significant growth for ORCL.
Rather than looking at long-term trends, however, the market seems to be focusing on ORCL’s earnings miss from its last quarter. Despite the fact that quarterly earnings are unaudited and cover a relatively small period, the market places a disproportionately large emphasis on them. ORCL fell 10% the day its earnings were announced, and has stayed cheap since, closing on April 24 at a cheap ~$32.51. At this valuation, ORCL has a price to economic book value of 0.9, which implies a permanent 10% decline in NOPAT. The opportunity to buy shares of such a highly profitable company at such a cheap price is a rare for investors. For more information on ORCL, see “Buy Oracle and Capitalize on Big Data Discount.”
Mutual Fund Series Trust: Eventide Gilead Fund (ETAGX) is my worst Mid Cap Growth mutual fund. It gets my Very Dangerous rating by allocating over 49% of its value to Neutral-or-worse-rated stocks, and to make matters worse, charges investors annual costs of 5.26%.
Macquarie Infrastructure Company (MIC) is one of my least favorite stocks held by ETAGX. Its 2% ROIC puts it in the bottom quintile of all companies we cover. In the eight years that our model covers, MIC has never had a high enough ROIC to make positive economic earnings. With its extremely low NOPAT and comparatively high debt, MIC has an economic book value (value of the stock assuming no growth) of -$800 million, or -$16.85/share. However, it is currently valued at ~$53.87/share. To justify this valuation, MIC would need to grow NOPAT by 18% compounded annually for 16 years. For an infrastructure company, that is not a realistic scenario. The gap between MIC’s market valuation and its no-growth value makes it Very Dangerous to investors.
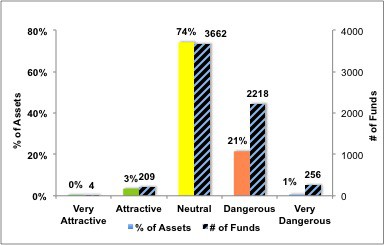
Figure 2 shows the distribution of our Predictive Ratings for all investment style ETFs and mutual funds.
Figure 2: Distribution of ETFs & Mutual Funds (Assets and Count) by Predictive Rating
 Source: New Constructs, LLC and company filings
Figure 3 offers additional details on the quality of the investment style funds. Note that the average Total Annual Cost of Very Dangerous funds is almost 6 times that of Very Attractive funds.
Note that the large majority (76%) of assets are in Neutral or Dangerous ETFs and mutual funds. I wonder if allocations to mediocre and poor funds would be the same if more investors had access to our research.
Figure 3: Predictive Rating Distribution Stats
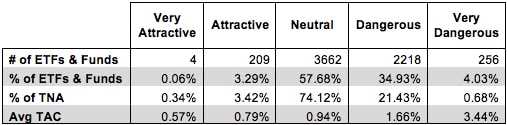 * Avg TAC = Weighted Average Total Annual Costs
Source: New Constructs, LLC and company filings
This table shows that only the best of the best funds get our Very Attractive Rating: they must hold good stocks AND have low costs. Investors deserve to have the best of both and we are here to give it to them.
Ratings by Investment Style
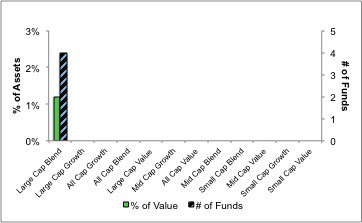
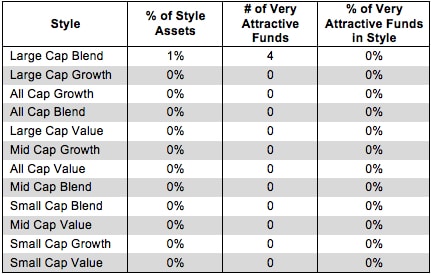
Figure 4 presents a mapping of Very Attractive funds by investment style. The chart shows the number of Very Attractive funds in each investment style and the percentage of assets in each style allocated to funds that are rated Very Attractive.
Only 4 investment style funds earn our Very Attractive rating.
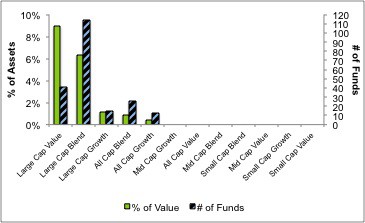
Figure 4: Very Attractive ETFs & Mutual Funds by Investment Style
 Source: New Constructs, LLC and company filings
Figure 5 presents the data charted in Figure 4
Figure 5: Very Attractive ETFs & Mutual Funds by Investment Style
 Source: New Constructs, LLC and company filings
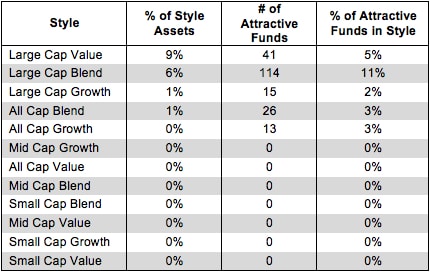
Figure 6 presents a mapping of Attractive funds by investment style. The chart shows the number of Attractive funds in each style and the percentage of assets allocated to Attractive-rated funds in each style.
The fact that only 6% of assets in the Large Cap Blend style are allocated to Attractive funds is troubling. With 114 Attractive rated funds (11% of funds in the style), investors have a lot of good to choose from. They should be allocating more than 6% to the best funds in this style.
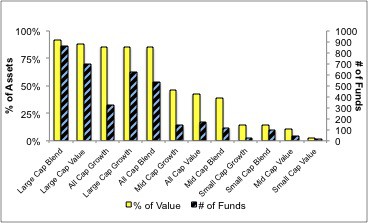
Figure 6: Attractive ETFs & Mutual Funds by Investment Style
 Source: New Constructs, LLC and company filings
Figure 7 presents the data charted in Figure 6.
Figure 7: Attractive ETFs & Mutual Funds by Investment Style
 Source: New Constructs, LLC and company filings
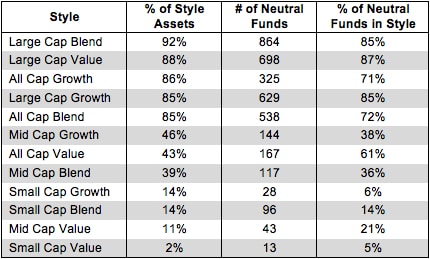
Figure 8 presents a mapping of Neutral funds by investment style. The chart shows the number of Neutral funds in each investment style and the percentage of assets allocated to Neutral-rated funds in each style.
Figure 8: Neutral ETFs & Mutual Funds by Investment Style
 Source: New Constructs, LLC and company filings
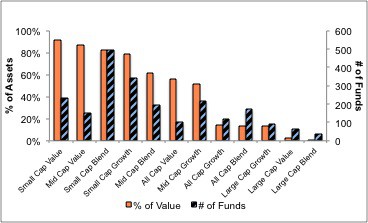
Figure 9 presents the data charted in Figure 8.
Figure 9: Neutral ETFs & Mutual Funds by Investment Style
 Source: New Constructs, LLC and company filings
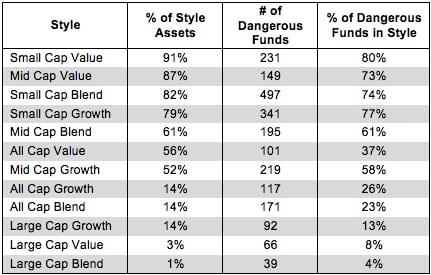
Figure 10 presents a mapping of Dangerous funds by fund style. The chart shows the number of Dangerous funds in each investment style and the percentage of assets allocated to Dangerous-rated funds in each style.
It’s concerning that the percentage of assets in Dangerous funds for several styles is higher than the percentage of Dangerous funds overall. Investors are disproportionately allocating to funds with poor holdings.
Figure 10: Dangerous ETFs & Mutual Funds by Investment Style
 Source: New Constructs, LLC and company filings
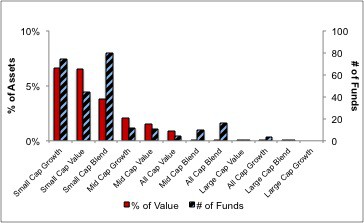
Figure 11 presents the data charted in Figure 10.
Figure 11: Dangerous ETFs & Mutual Funds by Investment Style
 Source: New Constructs, LLC and company filings
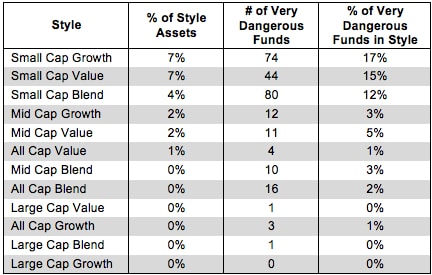
Figure 12 presents a mapping of Very Dangerous funds by fund style. The chart shows the number of Very Dangerous funds in each investment style and the percentage of assets in each style allocated to funds that are rated Very Dangerous.
Figure 12: Very Dangerous ETFs & Mutual Funds by Investment Style
 Source: New Constructs, LLC and company filings
Figure 13 presents the data charted in Figure 12.
Figure 13: Very Dangerous ETFs & Mutual Funds by Investment Style
 Source: New Constructs, LLC and company filings
Sam McBride contributed to this report.
Disclosure: David Trainer owns ORCL. David Trainer and Sam McBride receive no compensation to write about any specific stock, sector, or theme.