Fund holdings affect fund performance more than fees or past performance. A cheap fund is not necessarily a good fund. A fund that has done well in the past is not likely to do well in the future (e.g. 5-star kiss of death and active management has long history of underperformance). Yet, traditional fund research focuses only on low fees and past performance.
Our research on holdings enables investors to find funds with high quality holdings – AND – low fees.
Investors are good at picking cheap funds. We want them to be better at picking funds with good stocks. Both are required to maximize success.
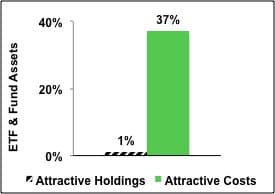
Figure 1 shows that 37% of fund assets are in ETFs and mutual funds with low costs but only 1% of assets are in ETFs and mutual funds with Attractive holdings. This discrepancy is astounding.
Figure 1: Allocation of Fund Assets By Holdings Quality and By Costs
 Sources: New Constructs, LLC and company filings
Two key shortcomings in the ETF and mutual fund industry cause this large discrepancy:
- A lack of research into the quality of holdings.
- Not enough research focuses on the quality of Portfolio Management of funds
- A lack of high-quality holdings or good stocks.
- With about twice as many funds as stocks in the market, there simply are not enough good stocks to fill all the funds.
These shortcomings are related. If investors had more insight into the quality of funds’ holdings, I think they would allocate less money to funds with poor quality holdings. Many funds would cease to exist.
Investors deserve research on the quality of stocks held by ETFs and mutual funds.
Quality of holdings is the single most important factor in determining an ETF or mutual fund’s future performance. No matter how low the costs, if the ETF or mutual fund holds bad stocks, performance will be poor. Costs are easy to find but research on the quality of holdings is almost non-existent.
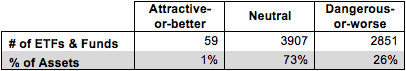
Figure 2 shows investors are not putting enough money into ETFs and mutual funds with high-quality holdings. Only 71 of 6917 (1% of assets) of ETFs and mutual funds allocate a significant amount of value to quality holdings. 99% of assets are in funds that do not justify their costs and over charge investors for poor portfolio management.
Figure 2: Distribution of ETFs & Mutual Funds (Count & Assets) By Portfolio Management Rating
 Source: New Constructs, LLC and company filings
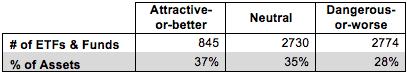
Figure 3 shows that investors successfully find low-cost funds. 37% of assets are held in ETFs and mutual funds that have Attractive-or-better rated Total Annual Costs, my apples-to-apples measure of the all-in cost of investing in any given fund.
Out of the 6449 ETFs and mutual funds I cover, 854 earn an Attractive-or-better Total Annual Costs rating.
Clearly, ETF and mutual funds investors are smart shoppers when it comes to finding cheap investments. But cheap is not necessarily good.
WisdomTree Mid Cap Dividend Fund (DON) is a good example of a fund with low costs but poor holdings. Its total annual costs are Very Attractive at 0.42%. However, it gets an overall predictive rating of Dangerous because no matter how low its fees, I expect it to underperform because it holds too many Dangerous-or-worse rated stocks. Low fees cannot boost fund performance. Only good stocks can boost performance.
NYSE Euronext (NYX) is one of my least favorite stocks held by DON and earns my Dangerous rating. NYX’s profits (NOPAT), which took a hit during the financial crisis in 2008, have continued to decline. They have fallen from $644 million in 2009 to $583 million in 2012. NYX’s return on invested capital (ROIC) is also just 4%, which puts it in the bottom quintile of all the companies I cover. In addition, NYX has earned negative economic earnings every year since it became public in 2007. Despite this recent record of profit decline, NYX remains overpriced at ~$45/share. To justify this share price, NYSE Euronext would need to grow NOPAT by 22% compounded annually for the next 6 years. These growth expectations would be a stretch for most companies, let alone one with the track record and uncertain regulatory future of NYX. Investors should avoid NYX stock as long as it remains this overpriced.
Figure 3: Distribution of ETFs & Mutual Funds (Count & Assets) By Total Annual Costs Ratings
 Source: New Constructs, LLC and company filings
Investors should allocate their capital to funds with both high-quality holdings and low costs because those are the funds that offer investors the best performance potential.
But they do not. Not even close.
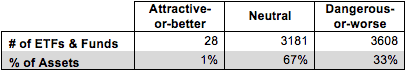
Figure 4 shows that 1% of ETF and mutual fund assets are allocated to funds with low costs and high-quality holdings according to my Predictive Fund Ratings, which are based on the quality of holdings and the all-in costs to investors.
Note the fund industry offers 3658 Dangerous-or-worse ETFs and mutual funds compared to just 28 Attractive-or-better ETFs and mutual funds, over 130 times more bad funds than good funds. That means a lot of fees are being paid to managers that do not deserve them.
Figure 4: Distribution of ETFs & Mutual Funds (Count & Assets) By Predictive Ratings
 Source: New Constructs, LLC and company filings
Investors deserve forward-looking ETF and mutual fund research that assesses both costs and quality of holdings. For example, iShares High Dividend ETF (HDV) has Very Attractive total annual costs of just 0.44%, but still manages to allocate over 49% of its portfolio to Attractive-or-better rated stocks. This fund is proof that investors can have their cake and eat it too.
Eli Lilly & Company (LLY) is one of my favorite stocks held by HDV and earns my Attractive rating. In 2012, LLY earned an ROIC of 14%, well above the pharmaceutical industry median of 6%. LLY has had a free cash flow yield (free cash flow/enterprise value) above 7% for each of the past four years. LLY’s strong cash flow and its $11.5 billion in excess cash mean the company has no shortage of cash to return to investors or use to fund research on new products.
Despite these strong metrics, LLY’s valuation has been kept down by fears over the expiry of several of its patents in 2014. The good news for investors is that any potential loss in profits from these expirations is already priced in. At its current valuation of ~$50/share, LLY has a price to economic book value ratio of 0.8, which implies that LLY’s NOPAT will permanently decline by 20%. LLY’s profits will take a hit from the expiration of its patents, but it also has many new drugs in its pipeline that could make up for the lost revenue in the near future. Long term, it’s hard to imagine that a company with the resources and scale of LLY will experience a permanent decline in profitability. Currently, the risk in LLY is largely accounted for in its price while significant upside remains.
HDV has not been a great performer recently. Its total return of 18% over the last year falls well short of the S&P 500. However, past performance is not a good indicator of future results, and with quality holdings like LLY, HDV is set up to perform well for investors in the future.
Why is the most popular fund rating system based on backward-looking past performance?
I do not know, but I do know that the lack of transparency into the quality of portfolio management provides cover for the ETF and mutual fund industry to continue to over charge investors for poor portfolio management. How else could they get away with selling nearly 130 times more Dangerous-or-worse ETFs and mutual funds than Attractive-or-better?
John Bogle is correct – investors should not pay high fees for active portfolio management. His index funds have provided investors with many low-cost alternatives to actively managed funds.
However, by focusing entirely on costs, he overlooks the primary driver of fund performance: the stocks held by funds. Investors also need to beware certain Index Label Myths.
Research on the quality of portfolio management of funds empower empowers investors to make better investment decisions. Investors should no longer pay for poor portfolio management.
André Rouillard contributed to this report.
Disclosure: David Trainer is long LLY. David Trainer and André Rouillard receive no compensation to write about any specific stock, sector or theme.