Picking from the multitude of style ETFs is a daunting task. In any given style there may be as many as 48 different ETFs, and there are at least 236 ETFs across all styles.
Why are there so many ETFs? The answer is: because ETF providers are making lots of money selling them. The number of ETFs has little to do with serving investors’ best interests. Below are three red flags investors can use to avoid the worst ETFs:
- Inadequate liquidity
- High fees
- Poor quality holdings
I address these red flags in order of difficulty. Advice on How to Find the Best Style ETFs is here. Details on the Best & Worst ETFs in each style are here.
How To Avoid ETFs with Inadequate Liquidity
This is the easiest issue to avoid, and my advice is simple. Avoid all ETFs with less than $100 million in assets. Low asset levels tend to mean lower volume in the ETF and large bid-ask spreads.
How To Avoid High Fees
ETFs should be cheap, but not all of them are. The first step here is to know what is cheap and expensive.
To ensure you are paying at or below average fees, invest only in ETFs with an expense ratio below 0.45%, which is the average expense ratio of the 236 US equity ETFs I cover. Weighting the expense ratios by assets under management, the average expense ratio is lower at 0.19%. A lower weighted average is a good sign that investors are putting money in the cheaper ETFs.
Figure 1 shows the most and least expensive style ETFs in the US equity universe based on total annual costs. ProShares provides four of the most expensive ETFs while Fidelity ETFs are among the cheapest.
Figure 1: 5 Least and Most-Expensive Style ETFs
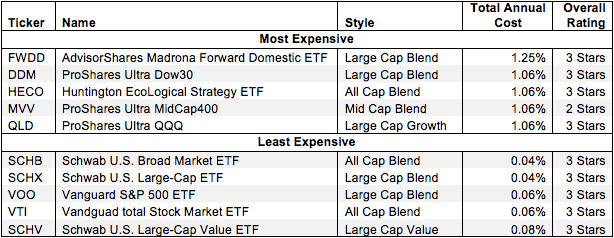 Sources: New Constructs, LLC and company filings
AdvisorShares Madrona Forward Domestic ETF (FWDD) and Huntington EcoLogical Strategy ETF (HECO) are two of the most expensive U.S. equity ETFs I cover, while Schwab U.S. Broad Market ETF (SCHB) and Schwab U.S. Large-Cap ETF (SCHX) are the least expensive. The more expensive DDM and MVV receive my 3-star or Neutral rating and 2-star or Dangerous rating respectively, while the cheapest ETFs receive my 3-Star or Neutral Rating. DDM is ranked higher than SCHX and SCHB however, because its superior holdings outweigh its higher costs.
Interestingly, ProShares Ultra Dow30 (DDM), in Figure 1, ranks 7th among all the style ETFs I cover overall despite being among the five most expensive. DDM holds one of the strongest portfolios among the ETFs that I cover.
However, investors need not pay high fees for good holdings. Schwab US Dividend Equity ETF (SCHD) is 2nd among all the style ETFs I cover, and earns my Neutral rating. It also has low total annual costs of only 0.08%.
This result highlights why investors should not choose ETFs based only on price. The quality of holdings matters more than price.
How To Avoid ETFs with the Worst Holdings
This step is by far the hardest, but it is also the most important because an ETF’s performance is determined more by its holdings than its costs. Figure 2 shows the ETFs within each style with the worst holdings or portfolio management ratings. The styles are listed in descending order by overall rating as detailed in my 1Q Style Ratings report.
Figure 2: Style ETFs with the Worst Holdings 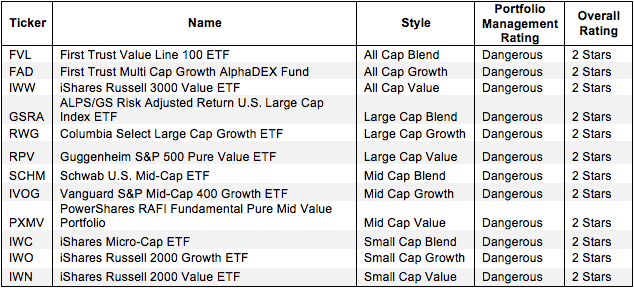 Sources: New Constructs, LLC and company filings
My overall ratings on ETFs are based primarily on my stock ratings of their holdings. My firm covers over 3000 stocks and is known for the due diligence done on each stock we cover.
iShares, and First Trust appear more often than any other providers in Figure 2, which means that they offer the most ETFs with the worst holdings. iShares Micro-Cap ETF (IWC) has the worst holdings of all Small Cap Blend style funds. iShares Russell 2000 Value ETF (IWN), Guggenheim S&P 500 Pure Value ETF (RPV), Columbia Select Large Cap Growth ETF (RWG), and First Trust Value Line 100 ETF (FVL) all have the worst holdings in their respective styles.
Note that no ETFs with a Dangerous portfolio management rating earn an overall rating better than two stars. These scores are consistent with my belief that the quality of an ETF is more about its holdings than its costs. If the ETF’s holdings are Dangerous, then the overall rating cannot be better than Dangerous because one cannot expect the performance of the ETF to be any better than the performance of its holdings.
Find the ETFs with the worst overall ratings on my ETF screener. More analysis of the Best Style ETFs is here.
The Danger Within
Buying an ETF without analyzing its holdings is like buying a stock without analyzing its business and finances. As Barron’s says, investors should know the Danger Within. Put another way, research on ETF holdings is necessary due diligence because an ETF’s performance is only as good as its holdings’ performance.
PERFORMANCE OF ETF’s HOLDINGs = PERFORMANCE OF ETF
Bad Stocks Make Bad ETFs
AutoNation Inc. (AN) is one of my least favorite stocks held by FWDD and earns my Dangerous rating. Over the past decade, AN’s after-tax profit (NOPAT) has declined by 1% compounded annually. AN currently earns a return on invested capital (ROIC) of 5% and has generated negative economic earnings since at least 1998. It’s surprising that a company with low and stagnant profits is valued so highly by the market. To justify its current valuation of ~$181/share, AN would have to grow NOPAT by 10% compounded annually for the next 21 years. This seems extremely optimistic given the company’s recent lack of growth. High expectations combined with zero growth make AN a stock investors should avoid.
Kyle Guske II contributed to this article
Disclosure: David Trainer and Kyle Guske II receive no compensation to write about any specific stock, sector, or theme.