The All Cap Growth style ranks sixth out of the twelve fund styles as detailed in my Style Rankings for ETFs and Mutual Funds report. It gets my Dangerous rating, which is based on aggregation of ratings of 2 ETFs and 463 mutual funds in the All Cap Growth style as of April 14, 2014. Prior reports on the best & worst ETFs and mutual funds in every sector and style are here.
Figure 1 ranks from best to worst the two all-cap growth ETFs and Figure 2 shows the five best and worst-rated all-cap growth mutual funds. Not all All Cap Growth style ETFs and mutual funds are created the same. The number of holdings varies widely (from 19 to 2080), which creates drastically different investment implications and ratings. The best ETFs and mutual funds allocate more value to Attractive-or-better-rated stocks than the worst, which allocate too much value to Neutral-or-worse-rated stocks.
To identify the best and avoid the worst ETFs and mutual funds within the All Cap Growth style, investors need a predictive rating based on (1) stocks ratings of the holdings and (2) the all-in expenses of each ETF and mutual fund. Investors need not rely on backward-looking ratings. My fund rating methodology is detailed here.
Investors seeking exposure to the All Cap Growth style should buy one of the Attractive-or-better rated ETFs or mutual funds from Figures 1 and 2.
Get my ratings on all ETFs and mutual funds in this style by searching for All Cap Growth on my mutual fund and ETF screener. For more products, click here.
Figure 1: ETFs with the Best & Worst Ratings
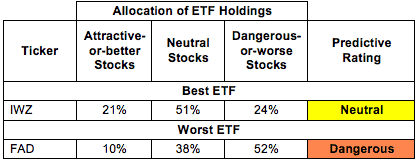 * Best ETFs exclude ETFs with TNAs less than $100 million for inadequate liquidity.
Sources: New Constructs, LLC and company filings
Figure 2: Mutual Funds with the Best & Worst Ratings – Top 5
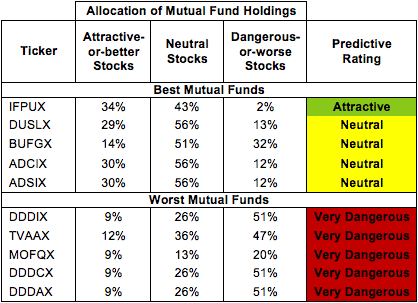 * Best mutual funds exclude funds with TNAs less than $100 million for inadequate liquidity.
Sources: New Constructs, LLC and company filings
Managers AMG Funds: Renaissance Large Cap Growth Fund (MRLIX) and Managers AMG Funds: Renaissance Large Cap Growth Fund (MRLSX) are excluded from Figure 2 because their total net assets (TNA) are below $100 million and do not meet our liquidity standards.
iShares Russell 3000 Growth ETF (IWZ) is my top-rated All Cap Growth ETF and Advisers Investment Trust: Independent Franchise Partenrs US Equity Fund (IFPUX) is my top-rated All Cap Growth mutual fund. IWZ earns my Neutral rating and IFPUX earns my Attractive rating.
First Trust Multi Cap Growth AlphaDEX Fund (FAD) is my worst-rated All Cap Growth ETF and Northern Lights Fund Trust: 13D Activist Fund (DDDAX) is my worst-rated All Cap Growth mutual fund. FAD earns my Dangerous rating and DDDAX earns my Very Dangerous rating.
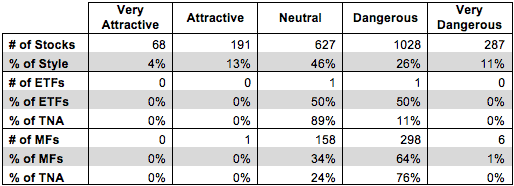
Figure 3 shows that 259 out of the 2201 stocks (over 17% of the market value) in All Cap Growth ETFs and mutual funds get an Attractive-or-better rating, but no ETFs or mutual funds in the sector earn better than a Neutral rating. The takeaways are: mutual fund managers allocate too much capital to low-quality stocks and All Cap Growth ETFs hold poor quality stocks.
Figure 3: All Cap Growth Style Landscape For ETFs, Mutual Funds & Stocks
 Sources: New Constructs, LLC and company filings
As detailed in “Low-Cost Funds Dupe Investors”, the fund industry offers many cheap funds but very few funds with high-quality stocks, or with what I call good portfolio management.
Investors need to tread carefully when considering All Cap Growth ETFs and mutual funds, as no ETFs and only 1 mutual funds in the All Cap Growth style allocate enough value to Attractive-or-better-rated stocks to earn an Attractive rating.
QUALCOMM Inc. (QCOM) is one of my favorite stocks held by IWZ and earns my Attractive rating. For the past 10 years, QCOM has grown after-tax profit (NOPAT) by 23% compounded annually. QCOM currently earns a top quintile return on invested capital (ROIC) of 51%, which is up from 22% in 2009. QCOM has also generated positive economic earnings every year for the past decade. Despite its impressive growth, QCOM remains undervalued. The current valuation of ~$78/share gives QCOM a price to economic book value (PEBV) ratio of 1.3. This ratio implies the market expects QCOM to grow NOPAT by no more than 30% for the remaining life of the company. Given the company’s growth over the past decade, along with their outstanding profitability, this expectation seems pessimistic. QCOM is a strong, fast growing company that should comfortably exceed the market’s expectations.
Salesforce.com Inc. (CRM) is one of my least favorite stocks held by All Cap Growth ETFs and mutual funds and earns my Very Dangerous rating. CRM’s NOPAT has been in a decline since 2011, reaching an all time low of -$148 million in 2014. The company’s ROIC has been following along this same trend, and in 2014 CRM had an ROIC of -4%. As I wrote in December, CRM has pursued an aggressive acquisition strategy to maintain rapid revenue growth at the expense of its bottom line and balance sheet.
Until recently, the market has rewarded CRM for its revenue growth while ignoring its lack of profitability. Even though the stock has dropped 15% in the last two months, it remains significantly overvalued. To justify its current price of ~$53/share, CRM would need to grow revenues by 26% compounded annually for 11 years while simultaneously increasing NOPAT margins to 10%. Those are some awfully high expectations. CRM has yet to show it can achieve growth and profits at the same time, which is what it needs to justify its valuation.
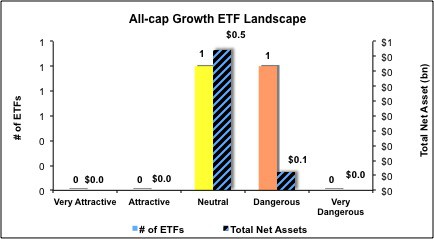
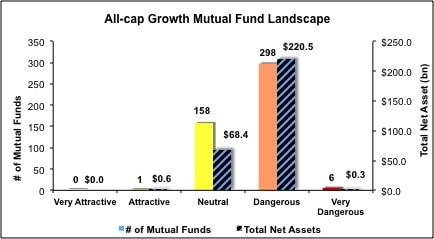
Figures 4 and 5 show the rating landscape of all All Cap Growth ETFs and mutual funds.
My Style Rankings for ETFs and Mutual Funds report ranks all styles and highlights those that offer the best investments.
Figure 4: Separating the Best ETFs From the Worst Funds
 Sources: New Constructs, LLC and company filings
Figure 5: Separating the Best Mutual Funds From the Worst Funds
 Sources: New Constructs, LLC and company filings
Review my full list of ratings and rankings along with reports on all 2 ETFs and 463 mutual funds in the All Cap Growth style.
Kyle Guske II contributed to this report.
Disclosure: David Trainer owns QCOM. David Trainer and Kyle Guske II receive no compensation to write about any specific stock, sector, style or theme.