The All Cap Value style ranks fourth out of the twelve fund styles as detailed in my Style Rankings for ETFs and Mutual Funds report. It gets my Neutral rating, which is based on aggregation of ratings of 2 ETFs and 243 mutual funds in the All Cap Value style as of April 14, 2014 Prior reports on the best & worst ETFs and mutual funds in every sector and style are here.
Figure 1 ranks from best to worst the two all-cap value ETFs and Figure 2 shows the five best and worst-rated all-cap value mutual funds. Not all All Cap Value style ETFs and mutual funds are created the same. The number of holdings varies widely (from 4 to 1956), which creates drastically different investment implications and ratings. The best ETFs and mutual funds allocate more value to Attractive-or-better-rated stocks than the worst, which allocate too much value to Neutral-or-worse-rated stocks.
To identify the best and avoid the worst ETFs and mutual funds within the All Cap Value style, investors need a predictive rating based on (1) stocks ratings of the holdings and (2) the all-in expenses of each ETF and mutual fund. Investors need not rely on backward-looking ratings. My fund rating methodology is detailed here.
Investors seeking exposure to the All Cap Value style should buy one of the Attractive-or-better rated ETFs or mutual funds from Figures 1 and 2.
Get my ratings on all ETFs and mutual funds in this style by searching for All Cap Value on my mutual fund and ETF screener. For more products, click here.
Figure 1: ETFs with the Best & Worst Ratings – Top 5
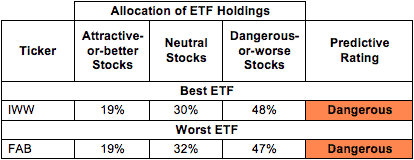 * Best ETFs exclude ETFs with TNAs less than $100 million for inadequate liquidity.
Sources: New Constructs, LLC and company filings
Figure 2: Mutual Funds with the Best & Worst Ratings – Top 5
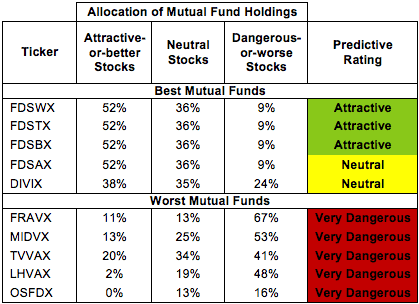 * Best mutual funds exclude funds with TNAs less than $100 million for inadequate liquidity.
Sources: New Constructs, LLC and company filings
iShares Russell 3000 Value ETF (IWW) is my top-rated All Cap Value ETF and SunAmerica Series, Inc: Focused Dividend Strategy Portfolio (FDSWX) is my top-rated All Cap Value mutual fund. IWW earns my Dangerous rating and FDSWX earns my Attractive rating.
First Trust Multi Cap Value AlphaDEX Fund (FAB) is my worst-rated All Cap Value ETF and Oceanstone Fund (OSFDX) is my worst-rated All Cap Value mutual fund. FAB earns my Dangerous rating and OSFDX earns my Very Dangerous rating.
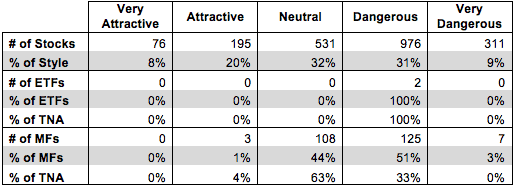
Figure 3 shows that 271 out of the 2098 stocks (over 28% of the market value) in All Cap Value ETFs and mutual funds get an Attractive-or-better rating. However, 0 out of 2 All Cap Value ETFs and 3 out of 243 All Cap Value mutual funds (less than 4% of total net assets) get an Attractive-or-better rating.
The takeaways are: mutual fund managers allocate too much capital to low-quality stocks and All Cap Value ETFs hold poor quality stocks.
Figure 3: All Cap Value Style Landscape For ETFs, Mutual Funds & Stocks
 Sources: New Constructs, LLC and company filings
As detailed in “Low-Cost Funds Dupe Investors”, the fund industry offers many cheap funds but very few funds with high-quality stocks, or with what I call good portfolio management.
Investors need to tread carefully when considering All Cap Value ETFs and mutual funds, as very few receive Attractive-or-better ratings. 0 ETFs and only 3 mutual funds in the All Cap Value style allocate enough value to Attractive-or-better-rated stocks to earn an Attractive rating.
CA Inc. (CA) is one of my favorite stocks held by All Cap Value ETFs and mutual funds and earns my Very Attractive rating. Over the past nine years, CA’s after-tax profit (NOPAT) has increased 19% compounded annually and their return on invested capital (ROIC) has increased to 13%, up from 5% in 2007. At its current price of ~$29/share, CA has a price to economic book value (PEBV) ratio of just 1.0. This ratio implies that the market expects CA to never grow NOPAT by any meaningful amount for the remainder of its corporate life. After almost a decade of double digit NOPAT growth, expectations of no growth going forward are too low and make CA an appealing investment.
Corning Inc (GLW) is one of my least favorite stocks held by FAB and earns my Very Dangerous rating. GLW’s NOPAT has declined by more than half over the past three years as its NOPAT margins have contracted from 52% in 2010 to 20% in 2013. ROIC has declined from 15% to 5% over this same time frame. More trouble is on the horizon for GLW, as it appears Apple’s (AAPL) new iPhone 6 will abandon GLW’s Gorilla Glass for competitor GT Advanced Technologies (GTAT) sapphire display.
Despite all its struggles, GLW is valued like a company that is growing profits rapidly. In order to justify its current valuation of ~$24.50/share, GLW would need to grow NOPAT by 12% compounded annually for 14 years. Those are some high expectations for a company with declining profits. Investors should stay away.
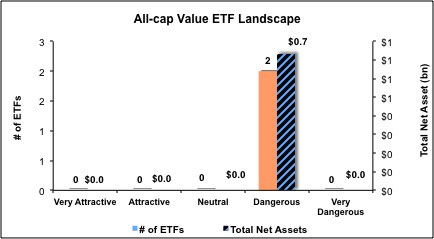
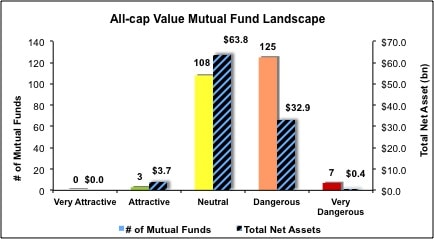
Figures 4 and 5 show the rating landscape of all All Cap Value ETFs and mutual funds.
My Style Rankings for ETFs and Mutual Funds report ranks all styles and highlights those that offer the best investments.
Figure 4: Separating the Best ETFs From the Worst Funds
 Sources: New Constructs, LLC and company filings
Figure 5: Separating the Best Mutual Funds From the Worst Funds
 Sources: New Constructs, LLC and company filings
Review my full list of ratings and rankings along with reports on all 2 ETFs and 243 mutual funds in the All Cap Value style.
To protect your portfolio from the worst ETFs and mutual funds, click here.
Kyle Guske II contributed to this report.
Disclosure: David Trainer and Kyle Guske II receive no compensation to write about any specific stock, sector, style or theme.