
Note to non-subscribers: We are no longer offering all of our reports for free. You may have noticed that many of the top experts in the financial sector value our reports quite highly. Barron’s has featured our best-in-market research seven times this year already as have USA Today, CNBC, MarketWatch.com, The Motley Fool, The Wall Street Journal, Abnormal Returns, Fox Business and the list goes on. Chuck Jaffe of MarketWatch listed our ratings as one of the three he looks at when picking a mutual fund or ETF. The other two: Morningstar andLipper.
We are offering this report for free for the 3Q14 Best and Worst ETFs and Mutual Funds series. However, most of our reports, which include detailed analysis of all 10 sectors and 12 fund styles, will be available to subscribers only. We will be updating all the sector reports and all the style reports from last quarter. For a limited time, you can get access to all our reports for just $9.99/month.
The Large Cap Growth style ranks fourth out of the twelve fund styles as detailed in my Style Rankings for ETFs and Mutual Funds report. It gets my Neutral rating, which is based on aggregation of ratings of 24 ETFs and 655 mutual funds in the Large Cap Growth style as of July 24, 2014. Prior reports on the best & worst ETFs and mutual funds in every sector and style are here.
Figures 1 and 2 show the five best and worst-rated ETFs and mutual funds in the style. Not all Large Cap Growth style ETFs and mutual funds are created the same. The number of holdings varies widely (from 21 to 675). This variation creates drastically different investment implications and, therefore, ratings. The best ETFs and mutual funds allocate more value to Attractive-or-better-rated stocks than the worst, which allocate too much value to Neutral-or-worse-rated stocks.
To identify the best and avoid the worstETFs and mutual funds within the Large Cap Growth sector, investors need a predictive ratingbased on (1) the stocks ratings of the holdings, (2) the all-in expenses of each ETF and mutual fund, and (3) the fund’s rank compared to all other ETFs and mutual funds. As a result, only the cheapest funds with the best holdings receive Attractive or better ratings. Investors need not rely on backward-looking ratings. My fund rating methodology is detailed here.
Investors seeking exposure to the Large Cap Growth style should buy one of the Attractive-or-better rated ETFs or mutual funds from Figures 1 and 2.
Get my ratings on all ETFs and mutual funds in this style by searching for Large Cap Growth on my free mutual fund and ETF screener.
Figure 1: ETFs with the Best & Worst Ratings – Top 5
 * Best ETFs exclude ETFs with TNAs less than $100 million for inadequate liquidity.
Sources: New Constructs, LLC and company filings
State Street SPDR MFS Systematic Growth Equity ETF (SYG) is excluded from Figure 1 because its total net assets (TNA) are below $100 million and do not meet our liquidity minimums.
Figure 2: Mutual Funds with the Best & Worst Ratings – Top 5
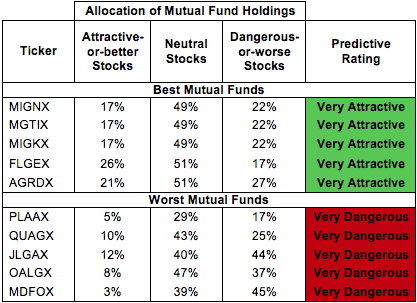 * Best mutual funds exclude funds with TNAs less than $100 million for inadequate liquidity.
Sources: New Constructs, LLC and company filings
Advisors’ Inner Circle Fund: Sarofim Equity Fund (SRFMX) is excluded from Figure 2 because its total net assets (TNA) are below $100 million and do not meet our liquidity minimums.
Shares MSCI USA Quality Factor ETF (QUAL) is my top-rated Large Cap Growth ETF and Massachusetts Investors Growth Stock Fund (MIGNX) is my top-rated Large Cap Growth mutual fund. Both earn my Very Attractive rating.
AlphaClone Alternative Alpha ETF (ALFA) is my worst-rated Large Cap Growth ETF and BlackRock Focus Growth Fund, Inc (MDFOX) is my worst-rated Large Cap Growth mutual fund. ALFA earns my Neutral rating and MDFOX earns my Very Dangerous rating.
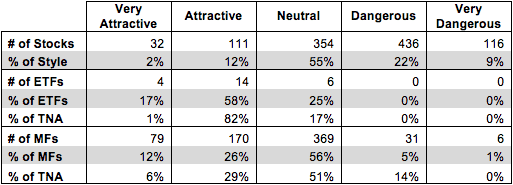
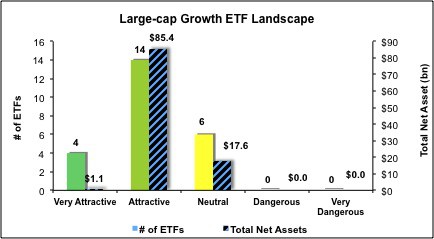
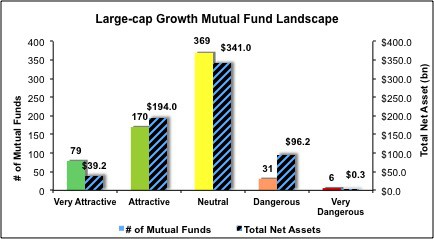
Figure 3 shows that 143 out of the 1049 stocks (over 14% of the market value) in Large Cap Growth ETFs and mutual funds get an Attractive-or-better rating. However, 18 out of 24 Large Cap Growth ETFs (83% of total net assets) and 249 out of 655 Large Cap Growth mutual funds (less than 35% of total net assets) get an Attractive-or-better rating.
The takeaway is: mutual fund managers allocate too much capital to low-quality stocks.
Figure 3: Large Cap Growth Style Landscape For ETFs, Mutual Funds & Stocks
 Sources: New Constructs, LLC and company filings
As detailed in “Cheap Funds Dupe Investors”, the fund industry offers many cheap funds but very few funds with high-quality stocks, or with what I call good portfolio management.
Investors need to tread carefully when considering Large Cap Growth ETFs and mutual funds, as 18 ETFs and 249 mutual funds in the Large Cap Growth style allocate enough value to Attractive-or-better-rated stocks to earn an Attractive rating.
Johnson & Johnson (JNJ) is one of my favorite stocks held by Large Cap Growth ETFs and mutual funds and earns my Attractive rating. Over the past fifteen years, JNJ has grown after-tax profits (NOPAT) by 10% compounded annually. Not once in those fifteen years has JNJ’s NOPAT declined. In addition to its impressive profit growth, JNJ boasts a top-quintile return on invested capital (ROIC) of 15%. Despite these strong numbers, the market has fairly low expectations for JNJ going forward. At its current price of ~$102/share, JNJ has a price to economic book value (PEBV) ratio of 1.2. This ratio implies that the market expects JNJ to grow NOPAT by no more than 20% from its current levels over the remaining life of the corporation. JNJ has proven its ability to grow profits at double digits while maintaining an impressive ROIC and should surpass these low expectations.
Adobe Systems, Inc. (ADBE) is one of my least favorite stocks held by Large Cap Growth ETFs and mutual funds and earns my Dangerous rating. Over the past five years, ADBE’s NOPAT has declined 15% compounded annually. ADBE currently earns an ROIC of only 6%, down from 16% in 2012. Despite declining profit and a rapidly falling ROIC, ADBE stock is up over 50% in the past year, which makes it significantly overvalued. To justify its current price of ~$72/share, ADBE must grow NOPAT by 15% compounded annually for the next 26 years. ADBE’s recent track record does not give me confidence that it can manage such high growth for a quarter of a century. Investors should avoid this stock.
Figures 4 and 5 show the rating landscape of all Large Cap Growth ETFs and mutual funds.
My Style Rankings for ETFs and Mutual Fundsreport ranks all styles and highlights those that offer the best investments.
Figure 4: Separating the Best ETFs From the Worst Funds
 Sources: New Constructs, LLC and company filings
Figure 5: Separating the Best Mutual Funds From the Worst Funds
 Sources: New Constructs, LLC and company filings
Review my full list of ratings and rankings along with reports on all 24 ETFs and 655 mutual funds in the Large Cap Growth style.
Kyle Guske II contributed to this report.
Disclosure: David Trainer is long JNJ. David Trainer and Kyle Guske II receive no compensation to write about any specific stock, sector, style or theme.