Recap from September Picks
Our Most Attractive and Most Dangerous stocks for October were made available at midnight on 10/9. We saw strong performances from picks made in September. Most Attractive Large Cap stock Hasbro Inc. (HAS) gained 2.1% and Most Attractive Small Cap stock Mannatech Inc. (MTEX) was up over 17%. 15 out of the 40 Most Attractive stocks outperformed the S&P 500.
Our Most Dangerous Stocks (-3.4%) declined by more than the S&P 500 (-1.3%). Most Dangerous Small Cap stock Natural Gas Services Group Inc. (NGS) fell by 14.5%. In an up and down month, 31 out of the 40 Most Dangerous stocks saw declines in share price, with 29 declining more than the S&P 500.
The successes of both Most Attractive and Most Dangerous picks highlight the value of our diligence. Being a true value investor is an increasingly difficult, if not impossible, task considering the complexity of ever-longer annual reports. By analyzing every word in 10-K filings, our research protects investors’ portfolios and allows our clients to execute value-investing strategies with more confidence and integrity.
7 new stocks make our Most Attractive list and 21 new stocks fall onto the Most Dangerous list this month.
Our Most Attractive stocks have high and rising return on invested capital (ROIC) and low price to economic book value ratios. Most Dangerous stocks have misleading earnings and long growth appreciation periods implied in their market valuations.
Most Attractive Stock: Arch Capital Group (ACGL: ~$55/share)
Arch Capital Group, Ltd. (ACGL) is one of the additions to our Most Attractive stocks for October. ACGL’s stock price has been on a rollercoaster this year. Growing revenue and after-tax profit (NOPAT) along with a cheap valuation make this stock one to watch.
Since bottoming in 2011, ACGL has grown NOPAT by 31% compounded annually. Revenue has grown by 7% compounded annually during the same time. Revenue growth has continued into 2014, with ACGL announcing 21% growth YoY in their latest quarterly report.
ROIC is increasing much like NOPAT and revenue. In 2011, ACGL earned an ROIC of 9%. In 2013, the company’s ROIC had risen to 13%, which places it in the top 15 of all insurance companies I cover.
Despite industry-wide price declines that have lead to shrinking operating margins, ACGL has navigated the year rather well. However the market is unwilling to grant the stock a valuation as high as its peers. At its current price of ~$55/share, ACGL has a price to economic book value (PEBV) ratio of 0.7. This ratio implies that the market expects ACGL’s NOPAT to permanently decline by 30% from today’s level.
These expectations seem rather low, especially given that the market expects more from other insurance companies. For example, ACGL’s valuation, as measured by PEBV, ranks lower than 67 of the 100 insurance companies I cover. As stated above, ACGL has grown NOPAT by 31% compounded annually over the last 2 years while also increasing its ROIC. How can the market expect more from competitors who are doing less? ACGL should be able to surpass the market’s low expectations.
In a frothy market, one must dig deep to find truly undervalued companies, and ACGL looks like a good find.
Most Dangerous Stock Feature for October: Hess Corporation (HES: ~$77/share)
Hess Corporation (HES) is one of the additions to our Most Dangerous stocks for October. HES is very overvalued given its recent history as well as the accounting trickery used in 2013.
Since earning an ROIC of 10% in 2008, HES’s ROIC has been cut in half to 5% in 2013. HES has not generated positive economic earnings for five consecutive years. The economic earnings declined nearly tenfold in 2013.
This large decline is contrasted with an equally large increase in GAAP net income in 2013. HES sold oil fields and subsidiaries held in other countries near the end of 2013 and recorded these sales, over $2.1 billion in non-recurring income, in EPS. After removing this income, as well as over $700 million in declining LIFO reserves, we see that much of HES’s record net income of over $5 billion was achieved through accounting loopholes. We close these loopholes to reveal that HES’s NOPAT in 2013 was actually just $1.9 billion, a 25% decline from 2012. Figure 1 shows the disconnect between GAAP net income and NOPAT that occurred in 2013.
Figure 1: Cash Flows Down While Earnings Rise
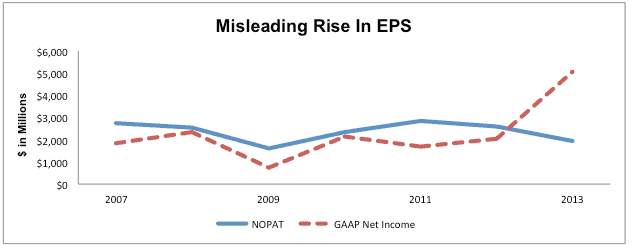
Source: New Constructs, LLC and company filings
Reported earnings in 2014 correlate more with our measure of cash flows than the overstated earnings in 2013. Revenues in 3Q14 were down over 14% from the year before and operating income declined 47%. A surplus supply of oil worldwide, oil prices falling to multi-year lows, and subsequent declines in gas prices, make it hard to believe HES can rapidly turn this ship around.
Why HES is not a Stock to Consider Buying
Taking everything into account, HES’s overvaluation is rather alarming. To justify its current price of ~$77/share, HES must grow NOPAT by 15% compounded annually for the next 10 years. Considering that HES’s NOPAT has declined since 2011, and this year’s trend doesn’t look much different, it will be extremely difficult to sustain that type of growth for a decade. It’s clear that the expectations embedded into HES’s stock price are dangerously high.
Kyle Guske II contributed to this report.
Disclosure: David Trainer and Kyle Guske II receive no compensation to write about any specific stock, sector, or theme.