
Large language models (LLMs) can’t pick good stocks.
It’s not because they don’t have enough data, but rather, they don’t have the right data.
To pick good stocks, and outperform the market, you need superior fundamental data, not the same stuff sourced from the internet by everyone else. How do we know?
Our Core Earnings data powers market-beating stock picking. We’re able to empirically prove the accuracy and reliability of our data because it is based on:
- Publicly available data in financial filings,
- Systematically gathering data into a clear ontology that supports sophisticated research, and
- Metrics and signals whose accuracy can be measured objectively by stock market performance.
There is no better proof that our Core Earnings data works than the novel alpha delivered via the outperformance of the Very Attractive Stocks Index, officially known as the Bloomberg New Constructs Ratings VA-1 Index (ticker: BNCVA1T:IND). This index holds the stocks in the Bloomberg US 1000 that get our Very Attractive rating. Thus, we refer to it as the Very Attractive Stocks Index. You can access our Core Earnings research directly on our site or through FinSights, our AI built on and by Google Cloud,
Below, we share one of the stocks in the Index along with a brief overview of why we think Very Attractive stocks provide quality risk/reward. Enjoy this free stock pick. Feel free to share it with friends and family. We are proud of our work and want more people to see it.
Featured Stock from Bloomberg New Constructs Ratings VA-1 Index: Interactive Brokers (IBKR)
Interactive Brokers (IBKR: $75/share) earns an overall Very Attractive rating, with Very Attractive ratings in four of the five criteria that drive our overall Stock Rating. See Figure 1.
Figure 1: Interactive Brokers’ Stock Rating
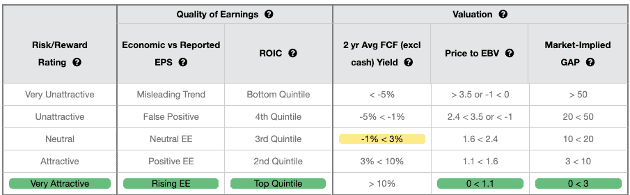
Sources: New Constructs, LLC and company filings
Quality of Earnings Analysis
Interactive Brokers earns a Very Attractive Economic vs. Reported Earnings rating and a Very Attractive top-quintile return on invested capital (ROIC) rating.
We like to see companies grow their economic earnings, the true cash flows of a business. Interactive Brokers has grown its economic earnings from $739 million in 2020 to $2.5 billion over the trailing-twelve-months (TTM), or 30% compounded annually. The company has improved its ROIC from 14% to 24% over the same time. See Figure 2.
Figure 2: Interactive Brokers’ Economic Earnings and ROIC: 2020 – TTM
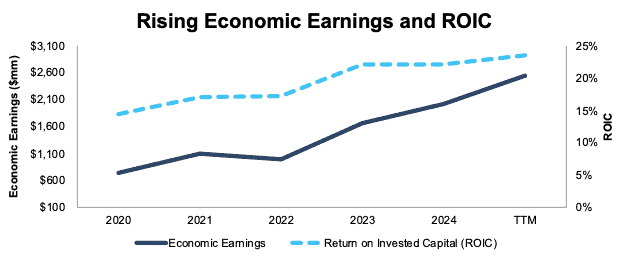
Sources: New Constructs, LLC and company filings
IBKR Is Undervalued
Interactive Brokers has a 2-year average FCF (excl. cash) yield between -1% and 3%, which earns a Neutral rating. However, the stock’s price-to-economic book value (PEBV) and market-implied growth appreciation period (GAP) both earn Very Attractive ratings.
More specifically, at its current price of $75/share, IBKR has a PEBV ratio of 1.1. This ratio means the market expects Interactive Brokers’ NOPAT to grow by just 10% over the remaining life of the company. This expectation seems overly pessimistic for a company that has grown NOPAT by 30% compounded annually since 2020 and 26% compounded annually since 2015.
The low expectations baked into Interactive Brokers’ stock price, along with strong quality of earnings, drive its Very Attractive Overall Stock Rating.
Background on our Stock Ratings
Five criteria drive our stock ratings. We divide those criteria into two categories: quality of earnings and valuation.
Quality of earnings criteria:
- Economic vs. Reported EPS: compares both the level and trend of Economic Earnings, the true cash flows of the business, vs. reported earnings.
- Return on Invested Capital (ROIC): measures how much profit a company generates for every dollar invested in the company.
Valuation criteria:
- 2-year Average Free Cash Flow (excluding cash) Yield: measures the true cash yield of a company.
- Price to Economic Book Value: measures the growth expectations implied by the company’s stock price.
- Market-Implied Growth Appreciation Period (GAP): measures the number of years of future profit growth required to justify the current valuation of the stock.
Stocks that get an overall Very Attractive rating are poised to outperform in any market.
Real-Time Proof of Superior Stock Ratings
The strong outperformance of the Very Attractive Stocks Index proves the superiority of our Stock Ratings. BNCVA1T outperformed the S&P 500 by 36% over the last 5 years, rising 114% compared to the S&P 500 rising 79% through January 30, 2026. See Figure 3.
Figure 3: Very Attractive-Rated Stocks Strongly Outperform the S&P 500 Over the Last Five Years
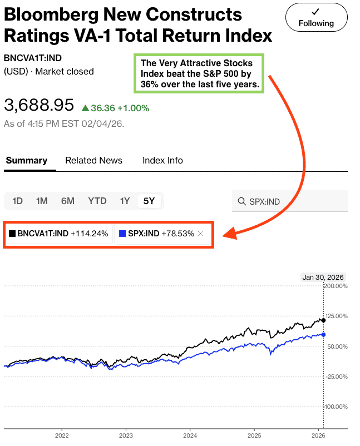
Sources: Bloomberg as of January 30, 2026
Note: Past performance is no guarantee of future results.
This article was originally published on February 6, 2026.
Disclosure: David Trainer and Kyle Guske II receive no compensation to write about any specific stock, style, or theme.
Questions on this report or others? Join our online community and connect with us directly.