
We seek the truth in company filings, footnotes, and MD&A, and we deliver it to our clients at scale via our alpha-generating Core Earnings research.
The Bloomberg New Constructs 500 Total Return Index (B500NCT:IND) offers real-time proof of the alpha that Core Earnings delivers. The index beat the S&P 500 by over 23% over the last five years. Provided by Bloomberg, this index takes the top 500 stocks by market cap and weights them based on Core Earnings Capture[1] instead of by market cap.
So, the companies whose Core Earnings exceed GAAP earnings by the most get the largest weightings. The companies with the highest true profits deserve larger allocations, and the results of this strategy speak for themselves. We like to call this index the “Enhanced S&P 500.”
Below, we share one of the stocks in this index along with a brief overview of why it deserves a larger weighting than it earns through market cap alone.
Enjoy this free stock pick. Feel free to share it with friends and family. We are proud of our work and want more people to see it.
Featured Stock from Bloomberg New Constructs 500 Total Return Index: Qualcomm (QCOM)
Qualcomm (QCOM: $138/share) is currently 0.2% of the S&P 500, but it is 1.0% of the Bloomberg New Constructs 500 Total Return Index. Why the discrepancy? Core Earnings power.
Qualcomm has the 9th highest Core Earnings Capture (10.0%) among the S&P 500 companies. A higher Core Earnings Capture means a larger weighting in this index. In the TTM ended fiscal 1Q26, Qualcomm’s Core Earnings exceed GAAP by $5.3 billion. In other words, Qualcomm is more profitable than investors relying on GAAP net income realize.
Qualcomm has grown Core Earnings much faster than reported earnings (GAAP Net Income) since fiscal 2024 after the two were relatively similar from fiscal 2020-2024.
Per Figure 1, Qualcomm’s Core Earnings grew from $9.2 billion in fiscal 2024 to $10.6 billion in the TTM, or an increase of 16%. Meanwhile, the company’s GAAP Net Income declined 47% from $10.1 billion to $5.4 billion.
Figure 1: Qualcomm’s Core Earnings vs. GAAP Net Income Since 2020
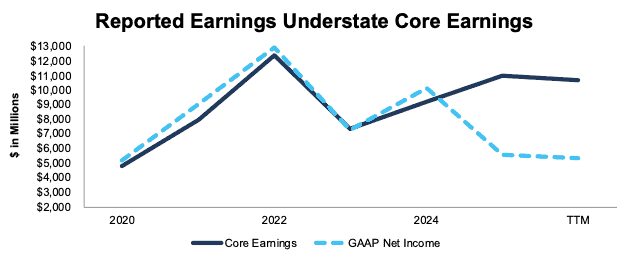
Sources: New Constructs, LLC and company filings
Not only does Qualcomm generate top-tier Core Earnings, the company has consistently grown its revenue, net operating profit after-tax (NOPAT), and return on invested capital (ROIC), too.
Qualcomm has grown revenue and NOPAT by 13% and 15% compounded annually since fiscal 2020, respectively. Qualcomm’s NOPAT margin increased from 23% in fiscal 2020 to 25% in the TTM while its invested capital turns remained at 1.2 over the same time. Rising NOPAT margins and steady invested capital turns drive Qualcomm’s ROIC from 27% in fiscal 2020 to 31% in the TTM.
Figure 2: Qualcomm’s Revenue and NOPAT Since 2020
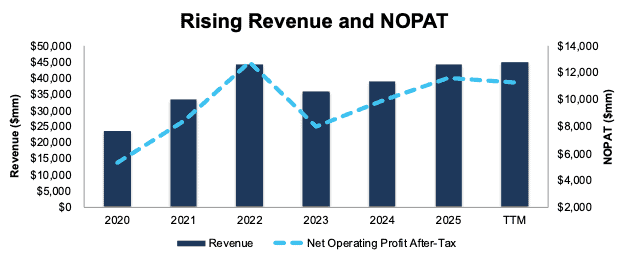
Sources: New Constructs, LLC and company filings
Real-Time Proof of the Alpha in Core Earnings
As noted above, you don’t have to take our word that Core Earnings, and allocating to stocks based on Core Earnings, drives novel alpha. The outperformance of the Bloomberg New Constructs 500 Index demonstrates real-time alpha.
Per Figure 3, the Bloomberg New Constructs 500 Total Return Index (ticker: B500NCT:IND) beat the S&P 500 by over 23% over the last five years, rising 98% while the S&P 500 was up 75%.
Figure 3: Bloomberg New Constructs 500 Index Strongly Outperforms the S&P 500 Over the Last 5 Years
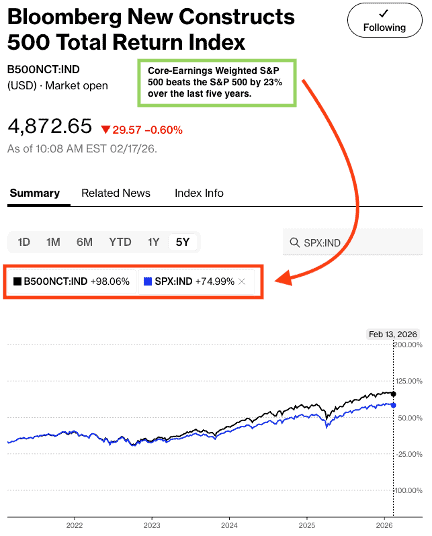
Sources: Bloomberg as of February 13, 2026
Note: Past performance is no guarantee of future results.
This article was originally published on February 17, 2026.
Disclosure: David Trainer and Kyle Guske II receive no compensation to write about any specific stock, style, or theme.
Questions on this report or others? Join our online community and connect with us directly.
[1] Earnings Capture equals Core Earnings minus GAAP earnings, divided by the company’s total assets. Note that GAAP Earnings Distortion equals GAAP Earnings minus Core Earnings, so high Earnings Distortion is bad.