
As investors clamor over the SpaceX hype and narrative, get sucked into Wall Street rigging indices for their own benefit, and try to find the next space opportunity, we’re here with a warning: the euphoria can’t last forever.
The soaring stock prices of SpaceX and related companies will meet reality. The wakeup call could be devastating to unsuspecting portfolios. This week’s Danger Zone pick is an ETF hoping this momentum never stops.
Below, we provide an excerpt from our latest Danger Zone report to show how our research helps you see danger before it crushes your portfolio. Get the full report a la carte here.
This ETF Provides Bad Risk/Reward
This ETF tracks an index designed to “capture companies whose products and services are driving innovation behind the exploration of deep space and deep sea.” Of the 35 holdings we cover:
- 100% have a return on invested capital (ROIC) below SPY,
- 57% have a 2-yr avg free cash flow (FCF) yield below SPY,
- 80% have a market-implied growth appreciation period (GAP) equal to SPY or higher, and
- 60% have a negative price-to-economic book value (PEBV) ratio or PEBV ratio greater than SPY.
Figure 3 in the full report shows the criteria behind our rating for this ETF. These criteria are the same for our Stock Ratings, because the performance of an ETF’s holdings drives the performance of the ETF after fees.
This ETF’s holdings are inferior to SPY in all five of the criteria that make up our Portfolio Management Rating. Specifically:
- The ETF’s holdings earn a Neutral Economic vs. Reported EPS rating, compared to an Attractive rating for SPY.
- The ETF’s ROIC is 3%, which is in the bottom quintile of our coverage universe and lower than SPY’s at 35%.
- The ETF’s 2-yr avg FCF yield of -0% is lower than SPY’s at 1%.
- The PEBV ratio for the ETF’s holdings is 5.9, which is much higher (worse) than SPY’s at 3.9.
- Our discounted cash flow analysis reveals an average market-implied GAP of 82 years for the ETF’s holdings compared to 61 years for SPY.
In other words, market expectations for stocks held by this ETF imply profits will grow substantially more than the stock’s held by SPY (measured by PEBV ratio and GAP), despite the ETF’s holdings being much less profitable (as measured by economic earnings and ROIC).
The ETF Is Worse than the Industrials Sector, Too
Our analysis reveals that this ETF allocates more capital to unprofitable companies with expensive valuations than State Street Industrial Select Sector SPDR ETF (XLI), which gets a Neutral rating.
The distinctions identified below highlight how holdings analysis allows investors to quantify expectations to avoid the worst of the worst in an otherwise Neutral-rated sector.
Per Figure 4, the ETF allocates 83% of its assets to Unattractive-or-worse rated stocks compared to 60% for XLI.
On the flip side, the ETF allocates only 15% of its assets to Neutral-or-better rated stocks compared to 40% for XLI.
Figure 4: This ETF’s Holdings Are Inferior to XLI
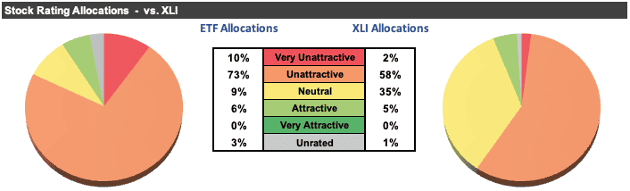
Sources: New Constructs, LLC and company filings
Higher Fees Make Owning This ETF Even Worse
Above average fees for inferior and more expensive holdings make this ETF even less attractive in any market.
The ETF’s 0.50% total annual costs (TAC) are above the 0.40% asset-weighted average of the Industrials ETFs and mutual for which we have assets data under coverage.
Figure 7 shows our breakdown of the ETF’s total annual costs, which is available for all 6,800+ mutual funds and ETFs under coverage.
Figure 7: Total Annual Costs Breakdown
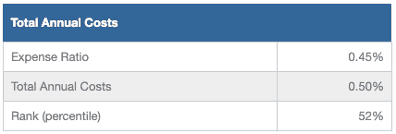
Sources: New Constructs, LLC and company filings
The Importance of Holdings Based Fund Analysis
We offer clients in-depth reports for all the 6,800+ ETFs and mutual funds under coverage.
Smart ETF (or fund) investing means analyzing each of the holdings of an ETF. Failure to do so is a failure to perform proper due diligence. Simply buying an ETF or mutual fund based on past performance does not necessarily lead to outperformance. Only thorough holdings-based research can help determine if an ETF or fund’s methodology leads managers to pick high-quality or low-quality stocks.
Our Robo-Analyst technology analyzes the holdings of all 35 ETFs and mutual funds in Industrials sector and 6,800+ ETFs and mutual funds under coverage to avoid “the danger within”.
Check Out the Indices Based on New Constructs Research
While we’re writing about indices and ETFs, we want to highlight the indices we’ve developed with Bloomberg’s Index Licensing Group. All three have outperformed the S&P 500 over the past five years. See Figures 8-10.
- Bloomberg New Constructs Core Earnings Leaders Index (ticker: BCORET:IND)
- Bloomberg New Constructs Ratings VA-1 Index (ticker: BNCVA1T:IND)
- Bloomberg New Constructs 500 Index (ticker: B500NCT:IND)
The Bloomberg New Constructs Core Earnings Leaders Index, which allocates based on Earnings Capture and Core Earnings, beat the S&P 500 by 33% over the past five years. The Index (ticker: BCORET:IND) was up 108% while the S&P 500 was up 75%.
Figure 8: Bloomberg New Constructs Core Earnings Leaders Index Outperforms S&P 500: Last 5 Years
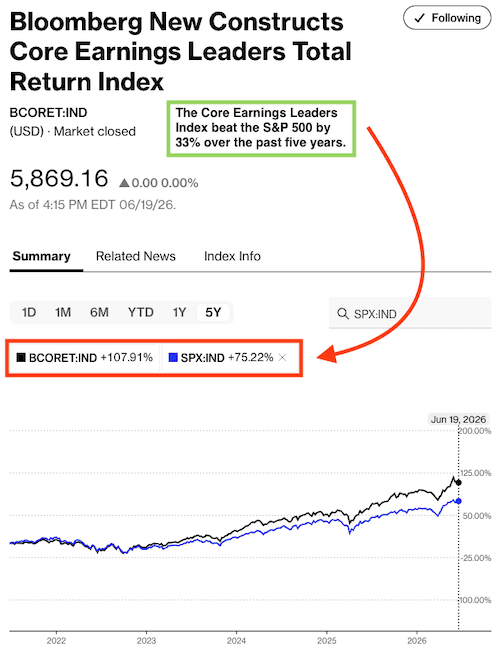
Sources: Bloomberg as of June 18, 2026
Note: Past performance is no guarantee of future results.
The “Very Attractive Stocks” Index, which allocates to stocks that get a Very Attractive rating by our AI Agent for Investing, beat the S&P 500 by 5% over the last five years. Bloomberg’s official name for the index is Bloomberg New Constructs Ratings VA-1 Index (ticker: BNCVAT1T:IND). Figure 9 shows it was up 80% while the S&P 500 was up 75%.
Figure 9: Very Attractive-Rated Stocks Strongly Outperform the S&P 500: Last Five Years
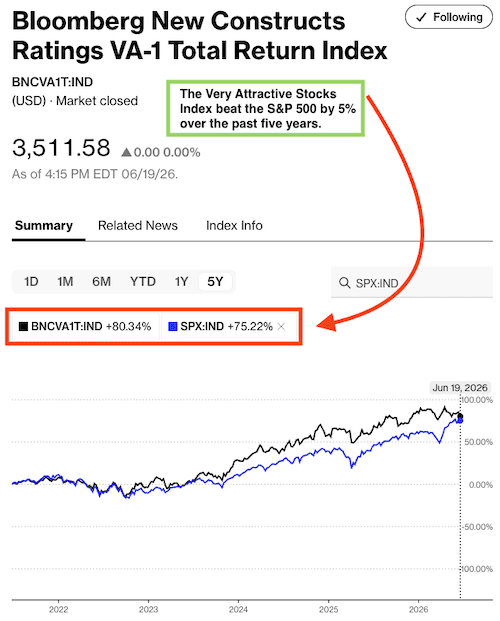
Sources: Bloomberg as of June 18, 2026
Note: Past performance is no guarantee of future results.
Our “Core-Earnings Weighted S&P 500” Index, which weights the largest 500 U.S. companies by Core Earnings instead of market cap, beat the S&P 500 by 21% over the past five years. Bloomberg’s official name for the index is Bloomberg New Constructs 500 Total Return Index (ticker: B500NCT:IND). Figure 10 shows it was up 96% while the S&P 500 was up 75%.
Figure 10: Bloomberg New Constructs 500 Index Strongly Outperforms the S&P 500: Last Five Years
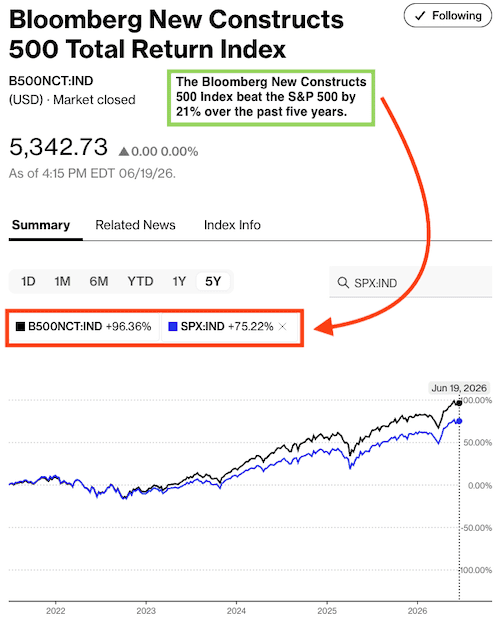
Sources: Bloomberg as of June 18, 2026
Note: Past performance is no guarantee of future results.
…there’s much more in the full report. You can buy the report a la carte here.
Or, become a Professional or Institutional member – they get all Danger Zone reports.
Interested in starting your membership to get access to more of our research? Get more details here.