Picking from the multitude of style ETFs is a daunting task. In any given style there may be as many as 49 different ETFs, and there are at least 237 ETFs across all styles.
Why are there so many ETFs? The answer is: because ETF providers are making lots of money selling them. The number of ETFs has little to do with serving investors’ best interests. Below are three red flags investors can use to avoid the worst ETFs:
- Inadequate liquidity
- High fees
- Poor quality holdings
I address these red flags in order of difficulty. Advice on How to Find the Best Style ETFs is here. Details on the Best & Worst ETFs in each style are here.
How To Avoid ETFs with Inadequate Liquidity
This is the easiest issue to avoid, and my advice is simple. Avoid all ETFs with less than $100 million in assets. Low asset levels tend to mean lower volume in the ETF and large bid-ask spreads.
How To Avoid High Fees
ETFs should be cheap, but not all of them are. The first step here is to know what is cheap and expensive.
To ensure you are paying at or below average fees, invest only in ETFs with an expense ratio below 0.45%, which is the average expense ratio of the 237 US equity style ETFs I cover. Weighting the expense ratios by assets under management, the average expense ratio is lower at 0.20%. A lower weighted average is a good sign that investors are putting money in the cheaper ETFs.
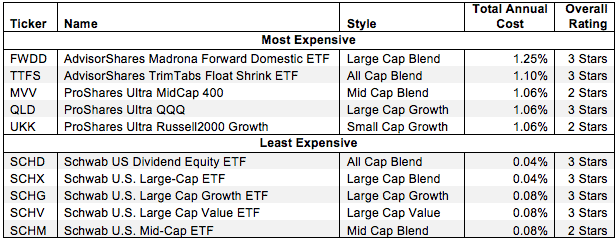
Figure 1 shows the most and least expensive style ETFs in the US equity universe based on total annual costs. ProShares provides 3 of the most expensive ETFs while Schwab ETFs are among the cheapest.
Figure 1: 5 Least and Most-Expensive Style ETFs
 Sources: New Constructs, LLC and company filings
AdvisorShares Madrona Forward Domestic ETF (FWDD) and ProShares Ultra QQQ (QLD) are two of the most expensive U.S. equity ETFs I cover, while Schwab U.S. Broad Market ETF (SCHB) and Schwab U.S. Large-Cap ETF (SCHX) are the least expensive. The more expensive FWDD and QLD receive my 3-star or Neutral rating, while the cheapest ETFs also receive my 3-Star rating. One of the most expensive ETFs, FWDD earns a better rating than one of the cheapest ETFs. Quality holdings can make up for high costs.
However, investors need not pay high fees for good holdings. Schwab US Dividend Equity ETF (SCHD) is my fifth highest rated style ETF and earns my Neutral rating. It also has low total annual costs of only 0.04%.
On the other hand, Schwab U.S. Mid Cap ETF (SCHM) holds poor stocks. And no matter how cheap an ETF, if it holds bad stocks, its performance will be bad.
This result highlights why investors should not choose ETFs based only on price. The quality of holdings matters more than price.
How To Avoid ETFs with the Worst Holdings
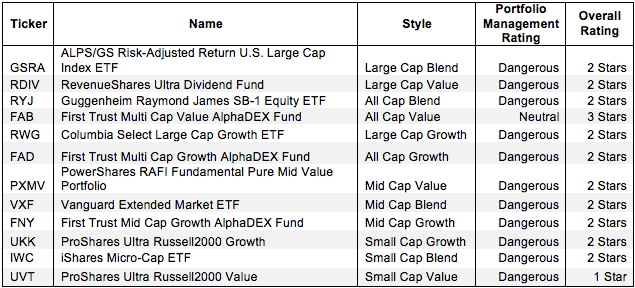
This step is by far the hardest, but it is also the most important because an ETF’s performance is determined more by its holdings than its costs. Figure 2 shows the ETFs within each style with the worst holdings or portfolio management ratings. The styles are listed in descending order by overall rating as detailed in my 2Q Style Rankings report.
Figure 2: Style ETFs with the Worst Holdings
 Sources: New Constructs, LLC and company filings
My overall ratings on ETFs are based primarily on my stock ratings of their holdings. My firm covers over 3000 stocks and is known for the due diligence done on each stock we cover.
First Trust and ProShares appear more often than any other providers in Figure 2, which means that they offer the most ETFs with the worst holdings. ProShares Ultra Russell2000 Value has the worst holdings of all Small Cap Value ETFs. IWC, FNY, VXF, FAD, and RYJ all have the worst holdings in their respective styles.
Note that no ETFs with a Dangerous portfolio management rating earn an overall rating better than two stars. These scores are consistent with my belief that the quality of an ETF is more about its holdings than its costs. If the ETF’s holdings are dangerous, then the overall rating cannot be better than dangerous because one cannot expect the performance of the ETF to be any better than the performance of its holdings.
Figure 2 reveals that one of the cheapest ETFs, Vanguard Extended Market ETF (VXF), gets my Dangerous rating because its holdings get my Dangerous rating. Similarly, PowerShares RAFI Fundamental Pure Mid Value Portfolio (PXMV), also one of the cheapest ETFs, gets a Dangerous portfolio management rating and, therefore, cannot earn anything better than a 2-star or Dangerous overall rating. Again, the ETF’s overall rating cannot be any better than the rating of its holdings.
Find the ETFs with the worst overall ratings on my ETF screener. More analysis of the Best Style ETFs is here.
The Danger Within
Buying an ETF without analyzing its holdings is like buying a stock without analyzing its business and finances. As Barron’s says, investors should know the Danger Within. Put another way, research on ETF holdings is necessary due diligence because an ETF’s performance is only as good as its holdings’ performance.
PERFORMANCE OF ETF’s HOLDINGs = PERFORMANCE OF ETF
Best & Worst Stocks In these ETFs
Baker Hughes, Inc. (BHI) is one of my least favorite stocks held by FWDD and earns my Dangerous rating. Over the past seven years, BHI’s after-tax profit (NOPAT) had declined by 1% compounded annually. The company’s return on invested capital (ROIC) is now a bottom quintile 4%, down from 13% in 2006. BHI has generated negative economic earnings for five straight years as well. Despite the declining fundamentals, BHI’s stock price is up over 50% in the last year, which has made it overvalued. To justify its current price of ~$70/share, BHI would need to grow NOPAT by 12% compounded annually for the next 53 years. Double-digit profit growth, over that time frame, is highly unlikely. Investors should avoid BHI.
Chevron Corp (CVX) is one of my favorite stocks held by SCHV and earns my Attractive rating. Over the past decade, CVX has grown NOPAT by 10% compounded annually. Even though 2013 was a down year for profits, CVX’s ROIC of 9% still matches Exxon Mobil (XOM) and surpasses ConocoPhillips (COP) at 6%. Despite this impressive profit growth and strong profitability, CVX remains undervalued. At the current price of ~$125/share, CVX has a price to economic book value (PEBV) ratio of 1.1. This ratio implies that the market expects CVX to grow NOPAT by only 10% for the remaining life of the company. This expectation seems rather low given CVX’s long-term track record.
Click here for a free trial of our ETF, mutual fund or stock research.
Kyle Guske II contributed to this article
Disclosure: David Trainer and Kyle Guske II receive no compensation to write about any specific stock, sector, or theme.