
A company’s future growth rate heavily influences its current valuation. Though straightforward in theory, it is awfully hard to estimate a company’s future growth rate for any period beyond a year or two.
Trying to predict the growth rate is not much different than trying to be a fortune teller. Would you trust a fortune teller to accurately predict your future?
Likely not…
That’s why our approach to valuation is “don’t be the fortune teller, be the critic of the fortune teller.” Mr. Market is the fortune teller, and it’s his only full-time job. He gives us a price every day for every stock. We focus on quantifying the future cash flows required to justify stock prices. Our approach to valuation is to compare the future cash flows implied by the stock price to the current cash flows of the business as well as other businesses. For Danger Zone picks, we identify where the differences between current and implied cash flows are the largest and where achieving the stock price-implied cash flows is least likely to occur.
Quantifying expectations, rather than predicting future growth, is a more objective way to approach investing.
In this week’s Danger Zone report, we feature a company whose valuation implies that it will go from one of the smallest to the largest retailer in its industry in the U.S. in the coming years.
Meanwhile, the company is unprofitable and lacks the scale of its much larger competitors.
When the disconnect between current and price-implied cash flows is this large, investors need to beware.
Below is a free excerpt from our latest Danger Zone report, published today to Pro and Institutional members. You can buy the full report a la carte here.
We’re not sharing the name of the company because that’s for our Professional and Institutional members. However, we think you’ll greatly enjoy the research because it provides insights into how hard we work to give you the best ideas and warnings.
Feel free to share with friends and family, and we hope your portfolio stays safe from stocks like this one.
This stock could fall further based on:
- continued lack of profits despite revenue growth,
- little to no competitive advantages,
- misleading adjusted earnings metrics,
- large cash burn, and
- a stock valuation that implies this company will become the largest optical retailer in the U.S.
Customer Price Points Maxing Out?
This company has increased its average revenue per customer (total revenue in the TTM divided by active customers) over the years. However, the growth rate in average revenue per customer has slowed significantly in recent periods.
Per Figure 1, the company’s YoY growth in average revenue per customer slowed in 7 of the past 8 quarters and has fallen from 10% YoY in 3Q23 to 5% YoY in 2Q25.
Should the company hit a ceiling on how much they’re able to charge customers, it will be much more difficult to maintain high revenue growth without significant marketing/outreach to attract new customers. In such a scenario, already negative margins would be further pressured and likely move in the wrong direction.
Figure 1: Average Revenue Per Customer YoY Growth Rate: 3Q23 – 2Q25
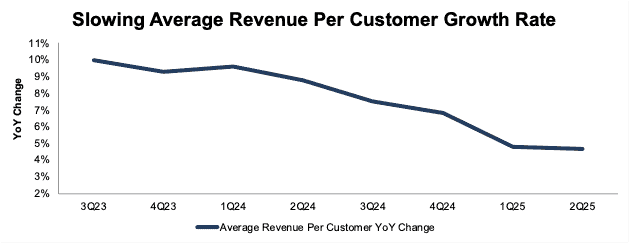
Sources: New Constructs, LLC and company filings
Misleading Preferred Earnings Metrics
If investors only analyze this company’s preferred non-GAAP metric, “adjusted EBITDA,” or even its GAAP net income, the company looks much better than the real economics of the business.
The company’s adjusted EBITDA improved from $22 million in 2019 to $85 million in the TTM and has been positive in every year since 2019, including the TTM.
Over the same time, the company’s GAAP net income improved from -$58 million to -$9 million, while its economic earnings, the true cash flows of the business, fell from -$19 million to -$76 million. See Figure 2.
Figure 2: GAAP Net Income vs. Economic Earnings vs. Adjusted EBITDA: 2019 – TTM
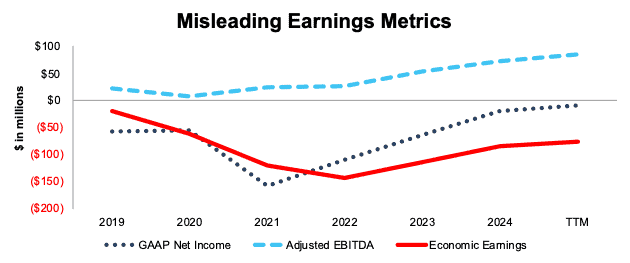
Sources: New Constructs, LLC and company filings
Cash Burn Continues in 2025
This company’s free cash flow (FCF) has been negative in every fiscal year of our model (since 2020).
From 2020 through 2Q25, the company burned through a cumulative $679 million (24% of enterprise value) in FCF. The company’s FCF was -$65 million in the TTM alone. See Figure 3.
The company doesn’t qualify as a Zombie Stock, because its cash on hand can support its existing cash burn for more than 24 months. However, if the company’s cash burn accelerates it could find itself as the next Zombie Stock.
Figure 3: Cumulative FCF Excluding Acquisitions: 2020 Through 1H25
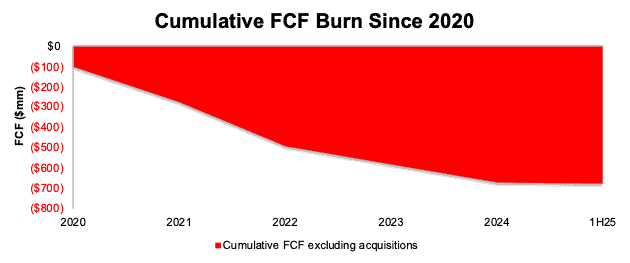
Sources: New Constructs, LLC and company filings
…there’s much more in the full report. You can buy the report a la carte here.
Or, become a Professional or Institutional member – they get all Danger Zone reports.
Interested in starting your membership to get access all our Danger Zone picks? Get more details here.