We recommend investors avoid or sell all industrial sector ETFs. We also rate the investment merit of the top six industrial sector ETFs.
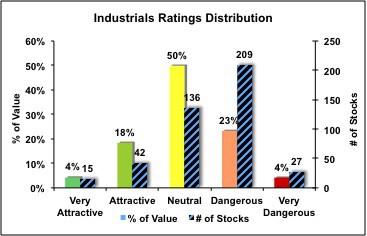
Per our first-quarter-2011 review of U.S. Equity Sector ETFs, the industrial sector is one of five sectors that gets our “neutral” rating. Per Figure 2, the industrial sector allocates 50% of its value to neutral-rate stocks with its remaining value split fairly evenly between attractive-or-better (22%) and dangerous-or-worse-rated (27%) stocks.
Some good stocks in the industrial sector to buy individually or as part of an ETF are United Parcel Service (UPS), 3M (MMM), Oshkosh Corporation (OSK) and Cubic Corporation (CUB). Some stocks to avoid, sell or short in the industrial sector are Federal Express (FDX), Tyco International (TYC) and Eaton Corporation (ETN).
Investors eyeing industrial sector ETFs should be careful. The sector offers stocks with both good and bad investment potential. The investment merit of each ETF derives from its constituents, so ETFs that overweight attractive-or-better-rated stocks, like MMM and UPS, can be great investment opportunities while ETFs that overweight neutral-or-worse-rated stocks, like FDX and ETN, should be avoided.
Figure 1: Industrial Sector – Capital Allocation & Holdings by Risk/Reward Rating
 Sources: New Constructs, LLC and company filings
When analyzing the industrial sector ETFs, we started by identifying those ETFs with acceptable structural integrity as measured by XTF, an ETF research firm. We chose the 6 ETFs whose XTF rating was above the sector average XTF rating.
Figure 2: Industrial ETFs With Acceptable Structural Integrity
 Sources: New Constructs, LLC; XTF and company filings
Figure 2 shows clearly that not all industrial ETFs are made the same. Different ETFs have meaningfully different numbers of holdings and, therefore, different allocations to holdings. Given the differences in holdings and allocations, these ETFs will likely perform quite differently.
After determining the structural integrity, we analyzed the investment merit of each ETF based on how it allocated value to each stock it held. Figure 3 shows how the six industrial sector ETFs stack up versus each other and the overall sector based on their overall risk/reward ratings and the allocation of their holdings by rating.
Figure 3: Investment Merit Based on Holdings and Allocations
 Sources: New Constructs, LLC; XTF and company filings
Attractive ETFs:
We find no attractive-or-better-rated industrials ETFs.
Neutral ETFs:
DIA, PPA, XLI, IYJ and VIS allocate the value of their funds in a way that earns them a neutral rating. We recommend investors buy the very attractive and attractive stocks in this sector before buying any of the industrials ETFs we cover in this report. Contact us for the full list of the 57 industrials companies that earn an attractive-or-better rating.
Dangerous ETFs:
We recommend investors avoid or sell short IYT because of its dangerous rating.
Benchmark Comparisons
Sector Benchmark
DIA outperforms the overall industrials sector in quality of earnings ratings. Both DIA and the sector earn very attractive economic vs. reported earnings ratings because their economic earnings are positive and rising. DIA earns an attractive ROIC rating with an ROIC of 11.8% compared to the sector’s ROIC of 9.2%.
DIA also outperforms the sector in valuation ratings. DIA has a GAP of 17 years, earning it a neutral rating, and a price-to-EBV of 1.1 compared to the overall sector’s GAP of 31 years and price-to-EBV of 1.5.
Figure 4: DIA – Risk/Reward Rating
 Sources: New Constructs, LLC and company filings
Figure 5: Industrials Sector – Risk/Reward Rating
 Sources: New Constructs, LLC and company filings
DIA more effectively allocates capital than the overall industrials sector. Per Figure 3 above, DIA allocates 60.7% of its value to attractive-or-better-rated stocks while the sector only allocates 22.7%. DIA also only allocates 16.4% of its value toward Dangerous-or-worse-rated stocks compared to the sector’s dangerous-or-worse weightings of 27.5%.
For explanation and details behind our risk/reward rating system, see one of our Company Valuation reports, which are available for free here.
Market Benchmark
The S&P 500 outperforms DIA in quality of earnings ratings. The S&P 500 and DIA earn very attractive economic vs. reported earnings ratings because their economic earnings are positive and rising. The S&P 500 earns a very attractive ROIC rating with an ROIC of 18.3% compared to DIA’s ROIC of 11.8%.
DIA outperforms the S&P 500 in valuation ratings. DIA has a GAP of 17 years, earning it a neutral rating, and a price-to-EBV of 1.1 compared to the S&P 500’s dangerous-rated GAP of 24 years and price-to-EBV of 1.4.
Figure 6: DIA – Risk/Reward Rating
 Sources: New Constructs, LLC and company filings
Figure 7: S&P 500 – Risk/Reward Rating
 Sources: New Constructs, LLC and company filings
DIA more effectively allocates capital than the S&P 500. Per Figure 3 above, DIA allocates 60.7% of its value to attractive-or-better-rated stocks while the S&P 500 only allocates 42.3%. DIA also only allocates 16.4% of its value toward dangerous-or-worse-rated stocks compared to the S&P 500’s dangerous-or-worse weightings of 23.7%.
Methodology
This report offers recommendations on Industrials sector ETFs and benchmarks for (1) investors considering buying industrials sector ETFs and for (2) comparing individual ETFs to the industrials sector and the S&P 500. Our analysis is based on aggregating results from our models on each of the companies included in every ETF and the overall sector (429 companies) based on data as of April 19th, 2011. We aggregate results for the ETFs in the same way the ETFs are designed. Our goal is to empower investors to analyze ETFs in the same way they analyze individual stocks.
To make an informed ETF investment, investors must consider:
1) The structural integrity of the ETF and its ability to fulfill its stated objective. We use XTF, an ETF research firm, to find the top six ETFs with the best structural integrity rating.
2) The quality of the ETF’s holdings. We determine an ETF’s quality using our stock ratings.
Given the success of our Rating system for individual stocks, we believe its application to groups of stocks (i.e. ETFs and funds) helps investors make more informed ETF and mutual fund buying decisions. Barron’s regularly features our unique ETF research.

3 replies to "Don’t Employ Any Industrial Sector ETFs"
[…] Sell or avoid buying all industrial sector ETFs. […]
[…] Sell or avoid buying all indusÂtrial secÂtor ETFs. […]
[…] Buy Industrials Like UPS And 3M But Avoid The ETFs Tuesday, May 10th, 2011 at 10:34 am Font size: var addthis_product = 'wpp-257'; var addthis_config = {"data_track_clickback":true};Sell or avoid buying all industrial sector ETFs. […]