
We have gone to great effort to build technology that gathers proven-superior data from financial filings, especially the footnotes, to train and power our AI-Agent, the Robo-Analyst.
We have unrivaled experience and success in endowing machines with the subject matter expertise needed to perform like human experts. Don’t just take our word for it. This paper from the Harvard Business School and MIT Sloan professors empirically proves the idiosyncratic alpha in our proprietary measure of Core Earnings.
Want real-time proof? Look no further than the Bloomberg New Constructs 500 Total Return Index (B500NCT:IND). This index, managed by Bloomberg, holds the largest 500 companies in the US. However, instead of weighting each stock by market cap, B500NCT:IND weights stocks based on Earnings Capture[1], which equals Core Earnings minus GAAP earnings. So, the companies whose Core Earnings exceed GAAP earnings by the most get the largest weightings. Think of this index as an enhanced version of the S&P 500, because it allocates capital based on a proven-superior fundamental metric instead of market cap.
We think companies with the highest profits deserve larger allocations, and the results of this strategy speak for themselves.
Below, we share one of the stocks in our enhanced S&P 500 Index along with a brief overview of why it deserves a larger weighting (by Core Earnings) than it earns through market cap alone. Enjoy this free stock pick. Feel free to share it with friends and family. We are proud of our work and want more people to see it.
Featured Stock from Bloomberg New Constructs 500 Total Return Index: Apple Inc. (AAPL)
Apple (AAPL: $211/share) is currently ~5% of the legacy S&P 500, but it is 7.6% of the Bloomberg New Constructs 500 Total Return Index. Why the discrepancy? Core Earnings power.
Apple has the highest trailing-twelve months (TTM) Core Earnings of all S&P 500 companies. In fact, Apple’s Core Earnings of $108 billion is the highest in our entire coverage universe. The company also has the second highest Earnings Capture ($10.6 billion) among the S&P 500. In other words, Apple’s reported GAAP earnings understate its Core Earnings by nearly $11 billion.
Not only does Apple generate the most Core Earnings, the company’s revenue, net operating profit after tax (NOPAT), and return on invested capital (ROIC) rank fourth, first, and sixth among the S&P 500 companies, respectively.
Apple has grown revenue and NOPAT by 21% and 36% compounded annually over the last two decades, respectively. Apple’s NOPAT margin increased from 2% in fiscal 2004 to 28% in the TTM while its invested capital turns fell from 9.0 to 2.9 over the same time. Rising NOPAT margins are more than enough to offset falling invested capital turns and drive Apple’s ROIC from 22% in fiscal 2004 to 81% in the TTM.
Figure 1: Apple’s Revenue and NOPAT Since Fiscal 2004
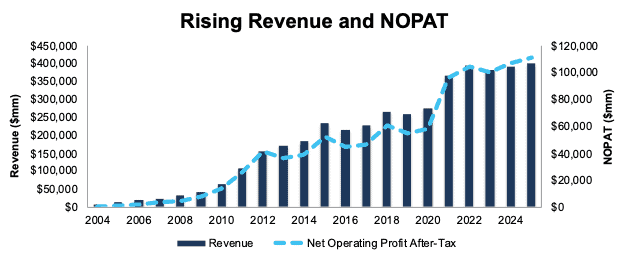
Sources: New Constructs, LLC and company filings
Apple has grown Core Earnings significantly faster than reported earnings (GAAP Net Income) in recent years. Per Figure 2, Apple’s Core Earnings grew from $51.6 billion in fiscal 2019 to $107.9 billion in the TTM ending fiscal 2Q25, or 14% compounded annually. The company’s GAAP Net Income increased from $55.3 billion to $97.3 billion over the same time, or 11% compounded annually.
Fiscal 2023 is a clear inflection point in Earnings Capture, as shown in Figure 2. In fiscal 2023, Apple’s Earnings Capture totaled -$3.5 billion, which means GAAP net income overstated Core Earnings by $3.5 billion.
In the TTM ended fiscal 2Q25, Apple’s Earnings Capture is $10.6 billion, which means GAAP net income understates Core Earnings by that amount. In other words, Apple is more profitable than investors relying on GAAP net income realize.
Figure 2: Apple’s Core Earnings vs. GAAP Net Income Since Fiscal 2019
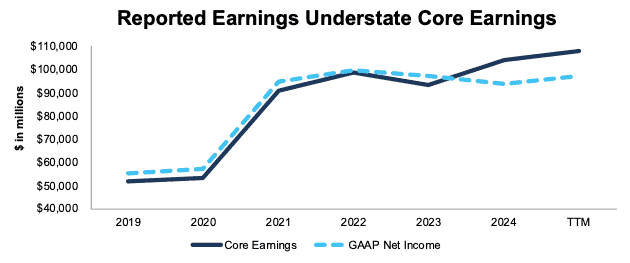
Sources: New Constructs, LLC and company filings
Real-Time Proof of Superior Earnings Metric
As noted above, you don’t have to take our word that Core Earnings, and allocating to stocks based on Core Earnings, drives novel alpha. The outperformance of the Bloomberg New Constructs 500 Index, or what we call the “Core-Earnings Weighted S&P 500”, demonstrates real-time alpha.
Per Figure 3, the Bloomberg New Constructs 500 Total Return Index (ticker: B500NCT:IND) beat the S&P 500 by over 31% over the last five years, rising 128% while the S&P 500 was up 96%.
Figure 3: Bloomberg New Constructs 500 Index Strongly Outperforms the S&P 500 Over the Last 5 Years
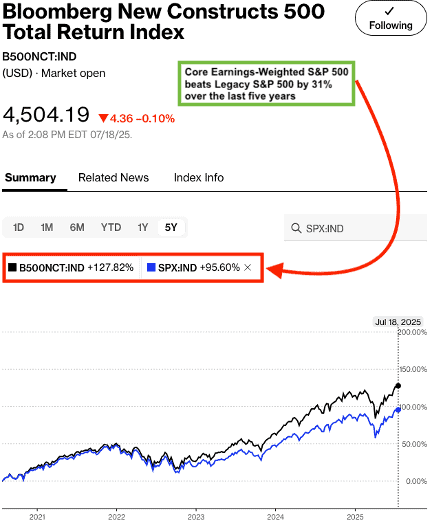
Sources: Bloomberg as of July 18, 2025
Note: Past performance is no guarantee of future results.
Wondering how the index has done more recently? See Figure 4 for details on the outperformance of the Bloomberg New Constructs 500 Total Return Index in the first half of 2025. B500NCT:IND was up 7.1% while the S&P 500 was up 6.8%.
Figure 4: Bloomberg New Constructs 500 Index Strongly Outperforms the S&P 500 in 1H25
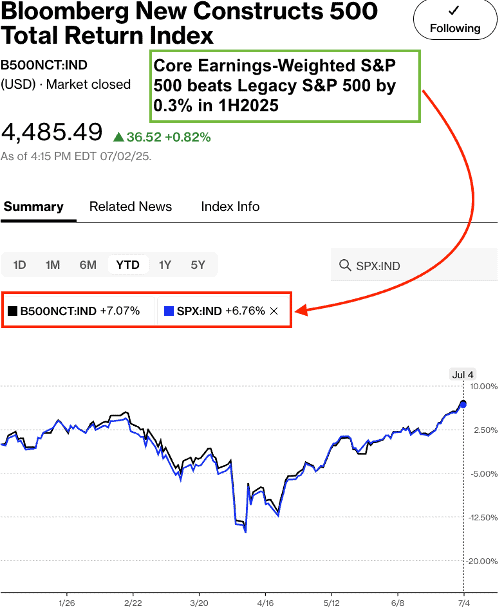
Sources: Bloomberg as of July 4, 2025
Note: Past performance is no guarantee of future results.
This article was originally published on July 31, 2025.
Disclosure: David Trainer, Kyle Guske II, and Hakan Salt receive no compensation to write about any specific stock, style, or theme.
Questions on this report or others? Join our online community and connect with us directly.
[1] Earnings Distortion equals GAAP earnings minus Core Earnings, or the opposite of Earnings Capture.