
The Bloomberg New Constructs Core Earnings Leaders Index (BCORET:IND), which picks stocks based on Core Earnings, beat the S&P 500 by 9% (27% vs 18%) in 2025.
Curious as to what drives our novel alpha?
In short, our index allocates capital to the 100 companies out of the Bloomberg 1000 whose Core Earnings exceed GAAP earnings by the most relative to the size of the company.
Core Earnings is a superior[1] earnings metric that adjusts reported earnings to remove unusual gains and losses found in the footnotes and MD&A in company filings. The outperformance of the Core Earnings Leaders Index is real-time proof of the alpha you can get from our proprietary footnotes research and Core Earnings.
Below, we share one of the stocks in the Core Earnings Leaders Index along with an overview of its Core Earning history and how much they exceed reported earnings.
Enjoy this free stock pick. Feel free to share it with friends and family.
Featured Stock from Bloomberg New Constructs Core Earnings Leaders Index: Kroger Company (KR)
Over the trailing-twelve months (TTM), Kroger’s (KR: $64/share) Core Earnings equal $3.3 billion while its GAAP earnings are lower, at $769 million. The -$2.6 billion in GAAP Earnings Distortion, which is 5% of total assets, earns the company its place in the Core Earnings Leaders Index.
Kroger’s Core Earnings increased 14% compounded annually since fiscal 2020 while GAAP Net Income fell 13% compounded annually over the same time. In other words, the company is much more profitable than investors relying on GAAP net income can see.
Figure 1 shows how Kroger’s Core Earnings rose from $1.6 billion in fiscal 2020 to $3.3 billion in the TTM ending fiscal 3Q26 while GAAP Net Income fell from $1.7 billion to $769 million over the same time. Figure 1 also shows the clear disconnect between Core Earnings and GAAP Net Income in the TTM period.
Figure 1: Kroger’s Core Earnings vs. GAAP Net Income Since Fiscal 2020
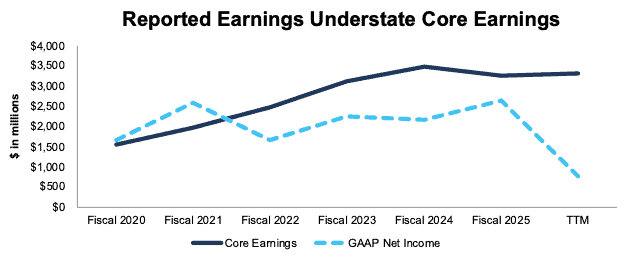
Sources: New Constructs, LLC and company filings
The company has grown revenue and Core Earnings by 3% and 6% compounded annually, respectively, over the last decade.
More recently, Kroger’s net operating profit after-tax (NOPAT) margin improved from 1.8% in fiscal 2020 to 2.9% in the TTM while its invested capital turns rose from 2.7 to 2.8 over the same time. Rising NOPAT margin and invested capital turns drive the company’s return on invested capital (ROIC) from 5% in fiscal 2020 to 8% in the TTM.
Figure 2: Kroger’s Revenue and Core Earnings Since Fiscal 2020
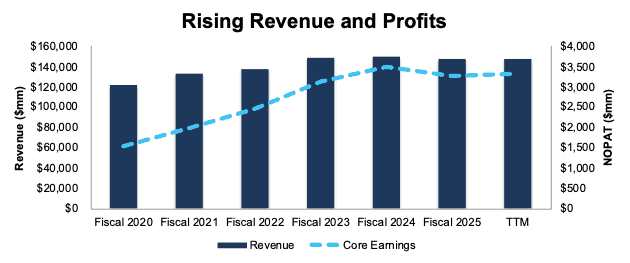
Sources: New Constructs, LLC and company filings
Real-Time Proof of Alpha Using a Superior Earnings Metric
As noted above, you don’t have to take our word for it when we say allocating capital based on Core Earnings drives novel alpha. The outperformance of the Bloomberg New Constructs Core Earnings Leaders Index demonstrates real-time alpha.
Per Figure 3, The Bloomberg New Constructs Core Earnings Leaders Index beat the S&P 500 by 9% in 2025. The Index (ticker: BCORET:IND) was up 27% while the S&P 500 was up 18%.
Figure 3: Bloomberg New Constructs Core Earnings Leaders Index Outperforms S&P 500 in 2025
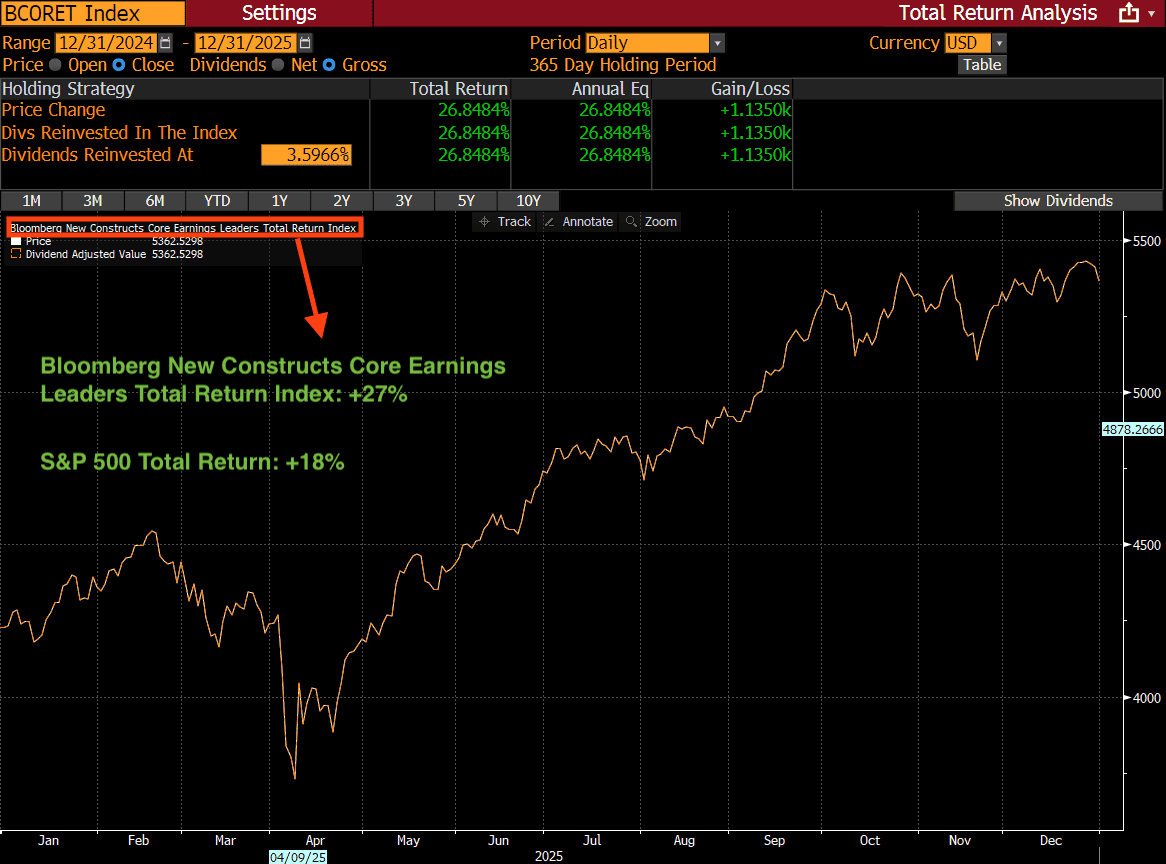
Sources: Bloomberg as of December 31, 2025
Note: Past performance is no guarantee of future results.
Per Figure 4, the Bloomberg New Constructs Core Earnings Leaders Index beat the S&P 500 by 36% over the past five years. The Index was up 114% while the S&P 500 was up 79%.
Figure 4: Bloomberg New Constructs Core Earnings Leaders Index Outperforms the S&P 500
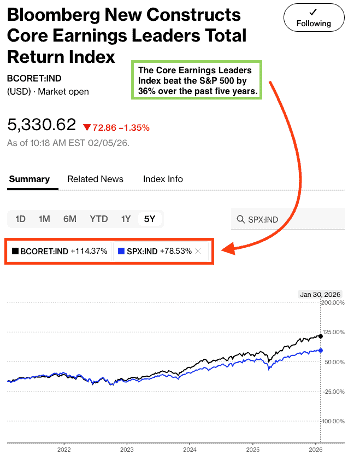
Sources: Bloomberg as of January 30, 2026
Note: Past performance is no guarantee of future results.
This article was originally published on February 5, 2026.
Disclosure: David Trainer and Kyle Guske II receive no compensation to write about any specific stock, style, or theme.
Questions on this report or others? Join our online community and connect with us directly.
[1] This paper from Harvard Business School and MIT Sloan professors empirically proves the idiosyncratic alpha in Core Earnings.