
For nearly a year, we’ve red-flagged the skyrocketing use of off-balance sheet debt to fund AI spending that certain companies could not otherwise afford.
Hidden debt isn’t just a balance sheet story, though. When there’s trillions of dollars in debt hidden off balance sheet, there’s also billions of expenses hidden off the income statement. We fix both.
In our latest report, we shine a light on this hidden expense, how it impacts earnings and the valuation, particularly the price-to-earnings (P/E) ratios, of the entire market.
Below, we provide an excerpt from our latest Danger Zone report to show how our research helps you see danger before it crushes your portfolio. Get the full report a la carte here.
The S&P 500 Is Overvalued and Shiller P/E Is at an All-Time High
The current P/E ratio of the S&P 500 based on aggregate market cap to aggregate GAAP earnings is ~26. The adjusted P/E ratio based on aggregate market cap to adjusted earnings (net of billions of hidden interest expense) is ~28.5. When we apply the current P/E ratio to the adjusted earnings, the math shows the S&P 500 should be much lower.
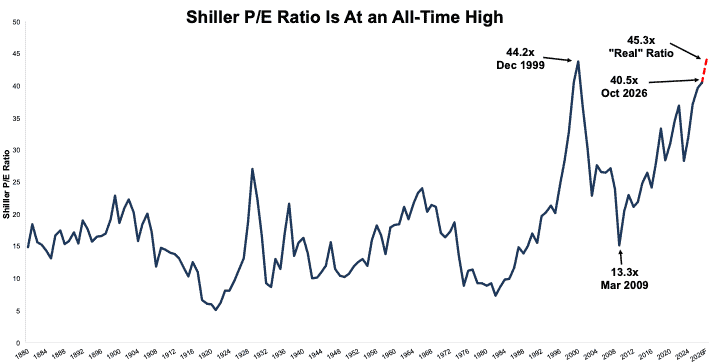
Let’s extend this analysis to the Shiller P/E ratio. If we assume the Schiller P/E ratio is off by the same percent as the P/E ratio, then the adjusted Shiller P/E ratios is 45.3, higher than the 40.5 (as of 10/16/2026) on which everyone else relies. At 45.3, the Shiller PE ratio is the highest in the history of the market.
Figure 1: Shiller P/E Ratio Is 45.3 After Adjusting for Hidden Interest Expense
Sources: New Constructs, LLC and Shiller Data
Hidden Debt Is Huge, Like $5.3 Trillion
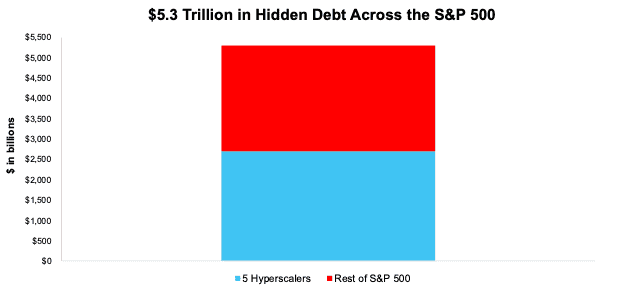
Across the S&P 500 we’ve identified $5.3 trillion in hidden debt reported in footnotes. You might notice that our hidden debt number is much higher than those reported by others. The difference is that we did the diligence and checked the footnotes for all the companies. As our clients can attest, all our work is 100% auditable. Our service makes it easy to trace every single footnote adjustment back to the source.
The five largest hyperscalers, Alphabet (GOOGL), Amazon (AMZN), Oracle (ORCL), Microsoft (MSFT), and Meta (META) hold over 50% of it, or $2.7 trillion. Meanwhile, these five companies show just $580 billion of debt on their balance sheets, or just 18% of their true total debt.
Figure 2: Hidden Debt in S&P 500: Hyperscalers vs. Rest of S&P 500: TTM
Sources: New Constructs, LLC and company filings
* Five hyperscalers in this analysis include Alphabet (GOOGL), Amazon (AMZN), Oracle (ORCL), Microsoft (MSFT), and Meta (META).
…there’s much more in the full report. You can buy the report a la carte here.
Or, become a Professional or Institutional member – they get all Danger Zone reports.
Interested in starting your membership to get access to more of our research? Get more details here.