
This report shows how well Health Care ETFs and mutual fund managers pick stocks. We juxtapose our Portfolio Management rating on funds, which grades managers based on the quality of the stocks they choose, with the number of good stocks available in the sector. This analysis shows whether or not ETF providers and mutual fund managers deserve their fees.
For example, if a fund has a poor Portfolio Management rating in a sector where there are lots of good stocks, that fund does not deserve the fees it charges, and investors are much better off putting money in a passively-managed fund or investing directly in the sector’s good stocks. On the other hand, if a fund has a good Portfolio Management rating in a sector where there are lots of bad stocks, then investors should put money in that fund assuming the fund’s costs are competitive.
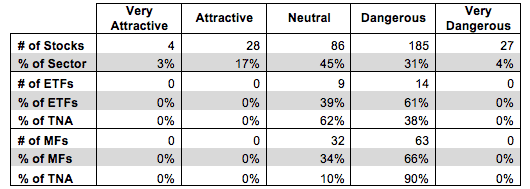
Figure 1 shows how many good stocks, according to our nationally-recognized ratings, are in the sector and their market cap. Next, it juxtaposes the Portfolio Management ratings of the ETFs and mutual funds in the sector. We think investors can gain an advantage with our forward-looking fund ratings since past performance is not a reliable predictor of future returns.
Figure 1 shows that 32 out of the 330 stocks (over 20% of the market value) in Health Care ETFs and mutual funds get an Attractive-or-better rating.
The main takeaway from Figure 1 is that despite a healthy number of good stocks in the sector, Health Care ETFs and mutual fund managers allocate heavily to stocks at the bottom end of the spectrum.
Zero out of 23 of ETFs allocate enough to quality stocks to earn an Attractive-or-better Portfolio Management rating. Mutual Fund managers have not fared much better. Zero out of 95 of mutual funds allocate enough of their assets to quality stocks to earn an Attractive-or better Portfolio Management rating. ETF providers and mutual fund managers need to do a better job to justify their fees.
With no high quality Health Care ETFs, it is not surprising that investors place the majority of their assets into Neutral-rated ETFs, and 38% of assets into Dangerous-rated ETFs. The picture is worse for Health Care mutual funds as over 90% of Health Care mutual fund assets are in Dangerous-rated funds. Investors in this sector would be better off sticking with a basket of Attractive-or-better rated stocks instead of paying undeserved fees to fund that do not allocate to quality stocks.
Figure 1: Health Care Sector: Comparing Quality of Stock Picking To Quality Of Stocks Available
Sources: New Constructs, LLC and company filings
iShares Dow Jones U.S. Medical Decides Index Fund (IHI) has the highest Portfolio Management rating of all Health Care ETFs and earns my Neutral Portfolio Management rating. Schwab Health Care Fund (SWHFX) has the highest Portfolio Management rating of all Health Care mutual funds and earns my Neutral Portfolio Management rating.
State Street SPDR S&P Biotech ETF (XBI) has the lowest Portfolio Management rating of all Health Care ETFs and earns my Dangerous Portfolio Management rating. Rydex Series Biotechnology Fund (RYBOX) has the lowest Portfolio Management rating of all Health Care mutual funds and earns my Dangerous Portfolio Management rating.
Medtronic (MDT) is one of my favorite stocks held by IHI and earns my Attractive rating. Medtronic has grown after-tax operating profit (NOPAT) by over 13% compounded annually since 1998 and earns a solid return on invested capital (ROIC) of 13%. Medtronic has also earned positive economic earnings every year since 2003. Despite its excellent history of profitability, Medtronic trades at only $65/share, which gives the stock a price to economic book value ratio (PEBV) of 1.1. This ratio implies that the market expects Medtronic to grow profits by just 10% for the remaining life of the company. This expectation seems very pessimistic considering Medtronic’s 13% compounded annual NOPAT growth for the past 16 years.
Vertex Pharmaceuticals (VRTX) is one of my least favorite stocks held by XBI and earns my Dangerous rating. Vertex has generated negative NOPAT and free cash flow for 14 of the past 16 years. The company currently earns a return on invested capital of below -3% and has earned negative economic earnings every year in my model, which tracks back to 1998. Despite the fact that Vertex has not generated any cash for investors, it trades at $106/share. To justify this price, Vertex would need to immediately achieve pre-tax margins of 10% and grow revenue by 25% compounded annually for the next 18 years. These kinds of expectations are unrealistic for almost any company, let alone one that has yet to earn a profit for more than two consecutive years. Vertex is too risky for investors in a sector with many other good stocks to choose from.
Many ETFs and mutual funds managers do a poor job identifying quality stocks. They allocate heavily to overvalued stocks like Vertex and don’t hold high quality stocks such as Medtronic. These funds are not worth owning at any cost.
The emphasis that traditional research places on low costs is a positive for investors, but low fees alone do not drive performance. Only good holdings can. Don’t fall prey to the index label myths. Even “passive” investors should be analyzing the holdings of their funds.
Our Best & Worst ETFs and Mutual Funds for the Health Care Sector report reveals our predictive ratings on the best and worst funds in the sector.
André Rouillard contributed to this report.
Disclosure: David Trainer and André Rouillard receive no compensation to write about any specific stock, sector, or theme.