
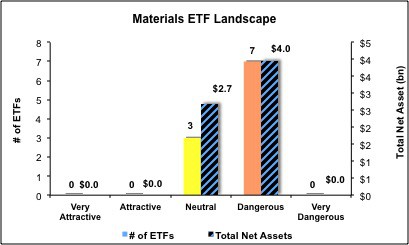
The Materials sector ranks sixth out of the ten sectors as detailed in my Sector Rankings for ETFs and Mutual Funds report. It gets my Neutral rating, which is based on aggregation of ratings of 10 ETFs and 15 mutual funds in the Materials sector as of April 18, 2013. Prior reports on the best & worst ETFs and mutual funds in every sector and style are here.
Figure 1 ranks from best to worst the eight Materials ETFs that met our liquidity standards and Figure 2 shows the five best and worst-rated Materials mutual funds. Not all Materials sector ETFs and mutual funds are created the same. The number of holdings varies widely (from 30 to 156), which creates drastically different investment implications and ratings. The best ETFs and mutual funds allocate more value to Attractive-or-better-rated stocks than the worst ETFs and mutual funds, which allocate too much value to Neutral-or-worse-rated stocks.
To identify the best and avoid the worst ETFs and mutual funds within the Materials sector, investors need a predictive rating based on (1) stocks ratings of the holdings and (2) the all-in expenses of each ETF and mutual fund. Investors need not rely on backward-looking ratings.
My fund rating methodology is detailed here.
Investors should not buy any Materials ETFs or mutual funds because none get an Attractive-or-better rating. If you must have exposure to this sector, you should buy a basket of Attractive-or-better rated stocks and avoid paying undeserved fund fees. Active management has a long history of not paying off.
Get my ratings on all ETFs and mutual funds in this sector on my free mutual fund and ETF screener.
Figure 1: ETFs with the Best & Worst Ratings – Top 5
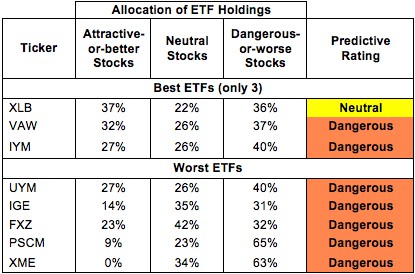 * Best ETFs exclude ETFs with TNAs less than $100 million for inadequate liquidity.
Sources: New Constructs, LLC and company filings
Guggenheim S&P Equal Weight Materials ETF (RTM) and PowerShares Dynamic Basic Materials (PYZ) are excluded from Figure 1 because their total net assets (TNA) are below $100 million and do not meet our liquidity standards.
Figure 2: Mutual Funds with the Best & Worst Ratings – Top 5
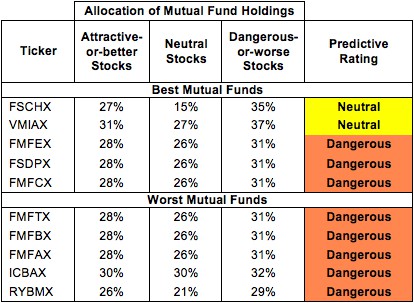 * Best mutual funds exclude funds with TNAs less than $100 million for inadequate liquidity.
Sources: New Constructs, LLC and company filings
ICON Materials Fund (ICBMX, ICBCX) and Rydex Series Funds: Basic Materials Fund (RYBIX, RYBAX) are excluded from Figure 2 because their total net assets (TNA) are below $100 million and do not meet our liquidity standards.
Materials Select Sector SPDR (XLB) is my top-rated Materials ETF and Fidelity Select Portfolios: Chemicals Portfolio (FSCHX) is my top-rated Materials mutual fund. Both earn my Neutral rating.
SPDR S&P Metals & Mining ETF (XME) is my worst-rated Materials ETF and Rydex Series Funds: Basic Materials Fund (RYBMX) is my worst-rated Materials mutual fund. Both earn my Dangerous rating.
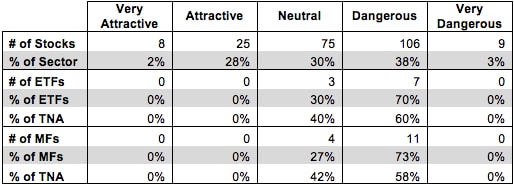
Figure 3 shows that 33 out of the 223 stocks (over 30% of the market value) in Materials ETFs and mutual funds get an Attractive-or-better rating. However, no Materials ETFs or mutual funds earn an Attractive rating.
With plenty of good stocks to choose from, it’s troubling that ETF providers and mutual fund managers are consistently allocating towards Neutral-or-worse rated stocks.
Materials ETFs and mutual funds are not justifying the fees they charge investors.
Figure 3: Materials Sector Landscape For ETFs, Mutual Funds & Stocks
 Sources: New Constructs, LLC and company filings
As detailed in “Cheap Funds Dupe Investors”, the fund industry offers many cheap funds but very few funds with high-quality stocks, or with what I call good portfolio management.
Investors should avoid Materials ETFs and mutual funds, as none allocate enough value to Attractive-or-better rated stocks to earn an Attractive rating. Investors seeking exposure to the Materials sector should buy a basket of Attractive-or-better rated stocks instead.
Kronos Worldwide, Inc. (KRO) is one of my favorite stocks held by Materials ETFs and mutual funds and earns my Very Attractive rating. KRO has historically had somewhat volatile cash flow, but over the past three years it has managed to maintain a return on invested capital (ROIC) above 10%, an impressive return for a chemicals company. Its ROIC for 2012 of 17% puts it in the top quintile of all companies we cover. What makes KRO a Very Attractive stock, however, is its low valuation. At just ~$15.00/share, KRO has a price to economic book value ratio of just 0.7. This low valuation implies a permanent 30% decline in KRO’s after tax profit (NOPAT). Low market expectations minimize the risk for investors while maximizing potential returns.
Rock-Tenn Company (RKT) is one of my least favorite stocks held by Materials ETFs and mutual funds and earns my Very Dangerous rating. This paper and packaging manufacturer has historically relied upon acquisitions to fuel growth, a strategy that often leads it to overpay for relatively modest cash flows. In 2011 it acquired Smurfit-Stone Container. The acquisition helped to grow RKT’s NOPAT by over 100%, but it also increased its invested capital by over 250%. Massive growth in invested capital combined with much smaller growth in profits leads to a low ROIC. RKT’s 4% ROIC for 2012 puts it in the bottom quintile of all the companies I cover. At ~$87.83/share, however, RKT is not valued commensurately with its low returns. To justify its valuation, RKT would need to grow NOPAT by 8% for 24 years. Such high expectations are ambitious for a packaging company. RKT does not have the resources to fund that level of growth through acquisitions, especially if the acquisitions are not creating value.
160 stocks of the 3000+ I cover are classified as Materials stocks, but due to style drift, Materials ETFs and mutual funds hold 223 stocks.
Figures 4 and 5 show the rating landscape of all Materials ETFs and mutual funds.
My Sector Rankings for ETFs and Mutual Funds report ranks all sectors and highlights those that offer the best investments.
Figure 4: Separating the Best ETFs From the Worst ETFs
 Sources: New Constructs, LLC and company filings
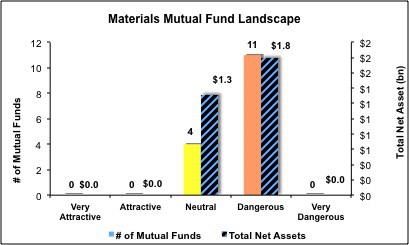
Figure 5: Separating the Best Mutual Funds From the Worst Mutual Funds
 Sources: New Constructs, LLC and company filin
Review my full list of ratings and rankings along with reports on all 10 ETFs and 15 mutual funds in the Materials sector.
Sam McBride contributed to this report
Disclosure: David Trainer and Sam McBride receive no compensation to write about any specific stock, sector or theme.