
The Energy sector ranks eighth out of the ten sectors as detailed in my Sector Rankings for ETFs and Mutual Funds report. It gets my Dangerous rating, which is based on aggregation of ratings of 19 ETFs and 86 mutual funds in the Energy sector as of January 15th, 2014. Prior reports on the best & worst ETFs and mutual funds in every sector are here.
Figures 1 and 2 show the five best and worst-rated ETFs and mutual funds in the sector. Not all Energy sector ETFs and mutual funds are created the same. The number of holdings varies widely (from 14 to 167), which creates drastically different investment implications and ratings. The best ETFs and mutual funds allocate more value to Attractive-or-better-rated stocks than the worst ETFs and mutual funds, which allocate too much value to Neutral-or-worse-rated stocks.
To identify the best and avoid the worst ETFs and mutual funds within the Energy sector, investors need a predictive rating based on (1) stocks ratings of the holdings and (2) the all-in expenses of each ETF and mutual fund. Investors need not rely on backward-looking ratings. My fund rating methodology is detailed here.
Investors should not buy any Energy ETFs or mutual funds because none get an Attractive-or-better rating. If you must have exposure to this sector, you should buy a basket of Attractive-or-better rated stocks and avoid paying undeserved fund fees. Active management has a long history of not paying off.
Get my ratings on all ETFs and mutual funds in this sector on my free mutual fund and ETF screener.
Figure 1: ETFs with the Best & Worst Ratings – Top 5
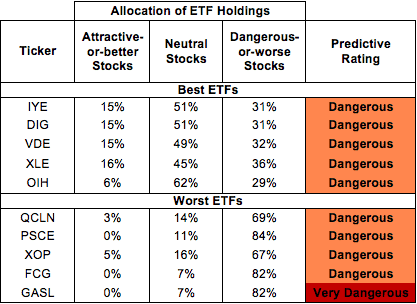 * Best ETFs exclude ETFs with TNAs less than $100 million for inadequate liquidity.
Sources: New Constructs, LLC and company filings
Fidelity MSCI Energy Index ETF (FENY) is excluded from Figure 1 because its total net assets (TNA) are below $100 million and do not meet our liquidity standards.
Figure 2: Mutual Funds with the Best & Worst Ratings – Top 5
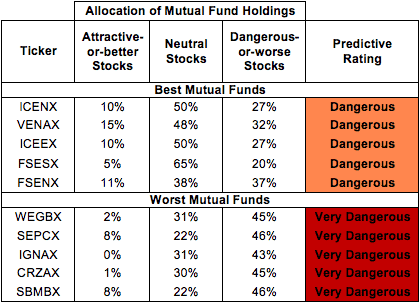 * Best mutual funds exclude funds with TNAs less than $100 million for inadequate liquidity.
Sources: New Constructs, LLC and company filings
WorldCommodity Funds Inc: WorldCommodity Fund (WCOMX) is excluded from Figure 2 because its total net assets (TNA) are below $100 million and do not meet our liquidity standards.
iShares U.S. Energy ETF (IYE) is my top-rated Energy ETF and ICON Funds: ICON Energy Fund (ICENX) is my top-rated Energy mutual fund. Both earn my Dangerous rating.
Direxion Daily Natural Gas Related Bull 3x Shares (GASL) is my worst-rated Energy ETF and Saratoga Advantage Trust: Energy and Basic Materials Portfolio (SBMBX) is my worst-rated Energy mutual fund. Both earn my Very Dangerous rating.
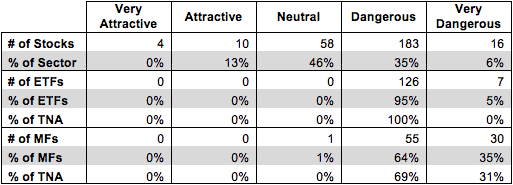
Figure 3 shows that 14 out of the 271 stocks (over 13% of the market value) in Energy ETFs and mutual funds get an Attractive-or-better rating. However, no Energy sector ETFs or mutual funds receive an Attractive-or-better rating.
The takeaways are: mutual fund managers allocate too much capital to low-quality stocks and Energy ETFs hold poor quality stocks.
Figure 3: Energy Sector Landscape For ETFs, Mutual Funds & Stocks
 Sources: New Constructs, LLC and company filings
As detailed in “Cheap Funds Dupe Investors”, the fund industry offers many cheap funds but very few funds with high-quality stocks, or with what I call good portfolio management.
Investors need to tread carefully when considering Energy ETFs and mutual funds, as no Energy sector ETFs or mutual funds receive an Attractive-or-better rating. Investors would be better off by focusing on individual stocks instead.
Chevron Corporation (CVX) is one of my favorite stocks held by IYE and earns my Attractive rating. Chevron has grown after-tax profits (NOPAT) by 23% compounded annually over the last 14 years. The company currently earns a return on invested capital (ROIC) of 11%. Chevron’s profitability, however, does not seem to be accurately reflected in its stock price. Currently trading at ~$120, CVX has a price-to-economic book value (PEBV) ratio of 0.8. This valuation implies that the market expects Chevron’s NOPAT to permanently decrease by 20%. Given CVX’s track record of growth, these expectations seem too pessimistic. Low expectations and strong growth make CVX an attractive pick for investors.
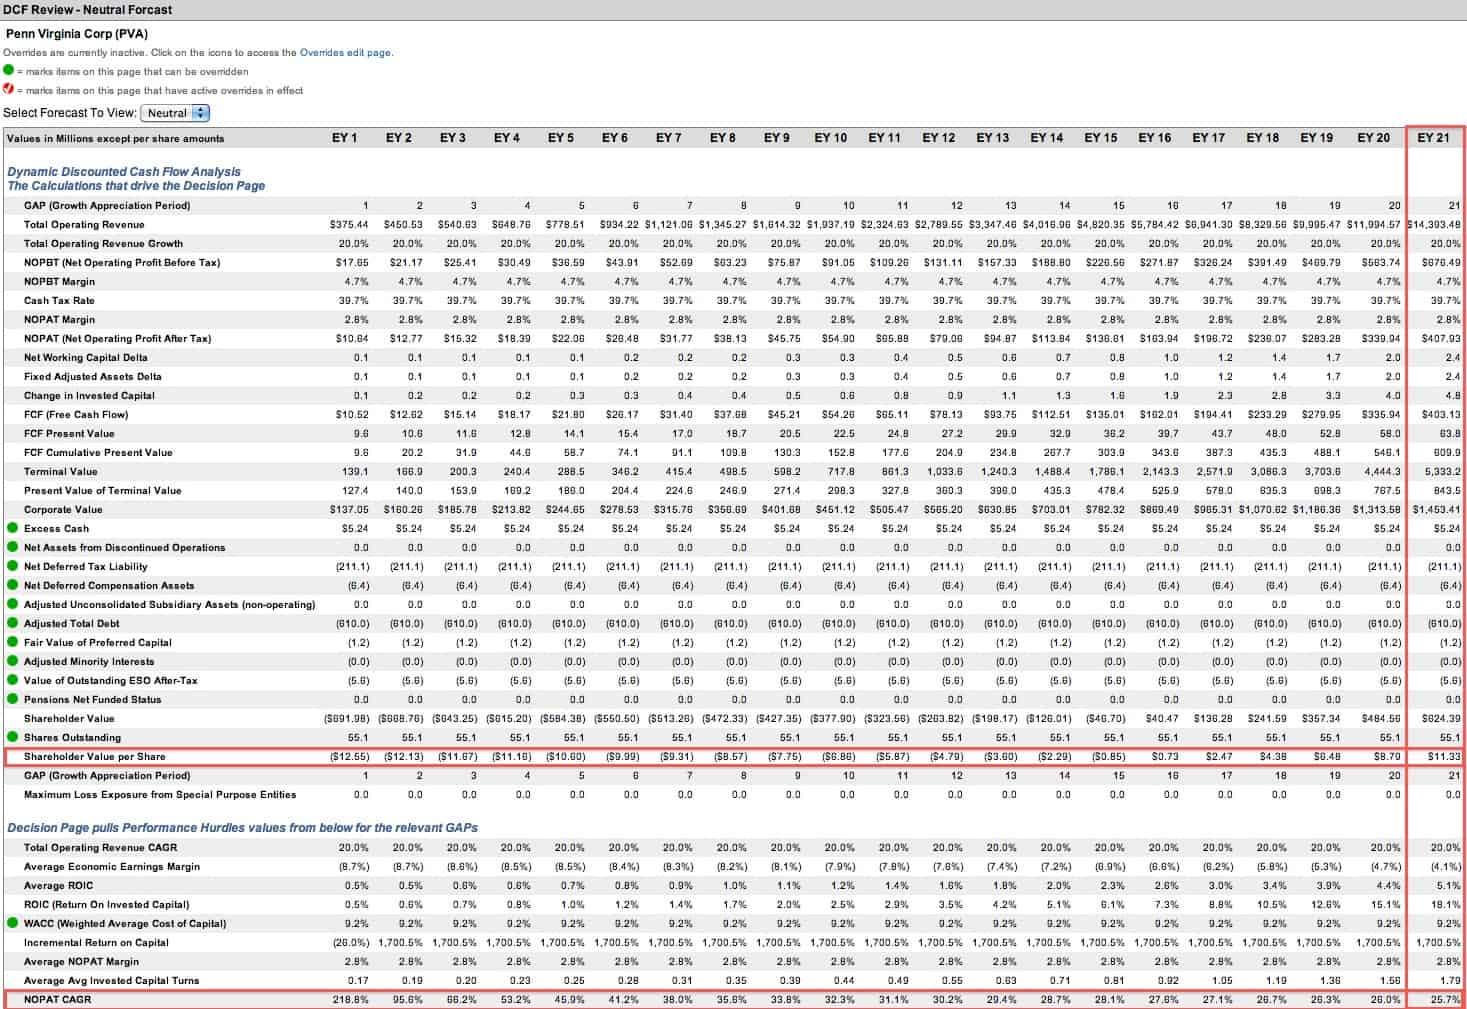
Penn Virginia Corp (PVA) is one of my least favorite stocks held by GASL and Energy mutual funds and earns my Dangerous rating. Penn Virginia Corp’s after-tax profits (NOPAT) have declined by 65% compounded annually since 2008 and its return on invested capital (ROIC) has dropped from 12% in 2005 to 0.1% in 2012. Penn Virginia Corp has also earned negative economic earnings in fourteen of the previous fifteen years. Despite this steep decline in profitability, there are high growth expectations embedded into the company’s stock price. To justify the ~$11/share price for PVA stock, PVA would have to grow NOPAT by 26% compounded annually for 21 years. These expectations seem very high for a company that is struggling to earn any profits. Investors should avoid PVA.
177 stocks of the 3000+ I cover are classified as Energy stocks, but due to style drift, Energy ETFs and mutual funds hold 271 stocks.
Figures 4 and 5 show the rating landscape of all Energy ETFs and mutual funds.
My Sector Rankings for ETFs and Mutual Funds report ranks all sectors and highlights those that offer the best investments.
Figure 4: Separating the Best ETFs From the Worst ETFs
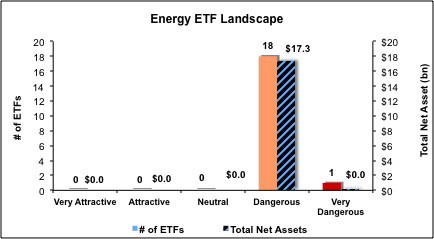 Sources: New Constructs, LLC and company filings
Figure 5: Separating the Best Mutual Funds From the Worst Mutual Funds
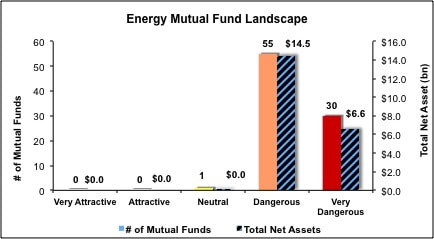 Sources: New Constructs, LLC and company filings
Review my full list of ratings and rankings along with reports on all 133 ETFs and 86 mutual funds in the Energy sector.
Jared Melnyk contributed to this report.
Disclosure: David Trainer owns CVX. David Trainer and Jared Melnyk receive no compensation to write about any specific stock, sector or theme.