
The Financials sector ranks ninth out of the ten sectors as detailed in my Sector Rankings for ETFs and Mutual Funds report. It gets my Dangerous rating, which is based on aggregation of ratings of 45 ETFs and 224 mutual funds in the Financials sector as of January 15, 2014 Prior reports on the best & worst ETFs and mutual funds in every sector are here.
Figures 1 and 2 show the five best and worst-rated ETFs and mutual funds in the sector. Not all Financials sector ETFs and mutual funds are created the same. The number of holdings varies widely (from 28 to 141), which creates drastically different investment implications and ratings. The best ETFs and mutual funds allocate more value to Attractive-or-better-rated stocks than the worst ETFs and mutual funds, which allocate too much value to Neutral-or-worse-rated stocks.
To identify the best and avoid the worst ETFs and mutual funds within the Financials sector, investors need a predictive rating based on (1) stocks ratings of the holdings and (2) the all-in expenses of each ETF and mutual fund. Investors need not rely on backward-looking ratings. My fund rating methodology is detailed here.
Investors should not buy any Financials ETFs or mutual funds because none get an Attractive-or-better rating. If you must have exposure to this sector, you should buy a basket of Attractive-or-better rated stocks and avoid paying undeserved fund fees. Active management has a long history of not paying off.
Get my ratings on all ETFs and mutual funds in this sector on my free mutual fund and ETF screener.
Figure 1: ETFs with the Best & Worst Ratings – Top 5
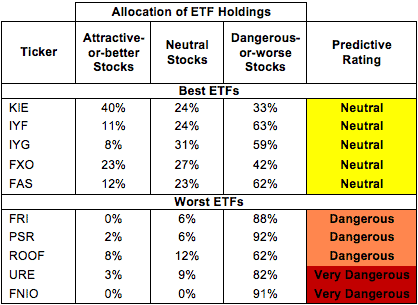 * Best ETFs exclude ETFs with TNAs less than $100 million for inadequate liquidity.
Sources: New Constructs, LLC and company filings
PowerShares KBW Property & Casualty Insurance Portfolio (KBWP) and PowerShares KBW Capital Markets Portfolio (KBWC) are excluded from Figure 1 because its total net assets (TNA) are below $100 million and do not meet our liquidity standards.
Figure 2: Mutual Funds with the Best & Worst Ratings – Top 5
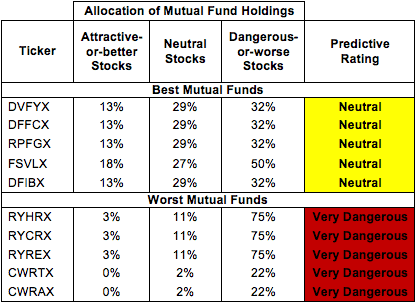 * Best mutual funds exclude funds with TNAs less than $100 million for inadequate liquidity.
Sources: New Constructs, LLC and company filings
State Street SPDR SPDR S&P Insurance ETF (KIE) is my top-rated Financials ETF and Davis Series, Inc: Davis Financial Fund (DVFYX) is my top-rated Financials mutual fund. Both earn my Neutral rating.
iShares Industrial/Office Real Estate Capped ETF (FNIO) is my worst-rated Financials ETF and Compass EMP Funds Trust: Compass EMP REC Enhanced Volatility Weighted Fund (CWRAX) is my worst-rated Financials mutual fund. Both earn my Very Dangerous rating.
Figure 3 shows that 62 out of the 555 stocks (over 6% of the market value) in Financials ETFs and mutual funds get an Attractive-or-better rating. However, no Financials ETFs or mutual funds get an Attractive-or-better rating.
The takeaway is: mutual fund managers allocate too much capital to low-quality stocks and Financials ETFs hold poor quality stocks.
Figure 3: Financials Sector Landscape For ETFs, Mutual Funds & Stocks
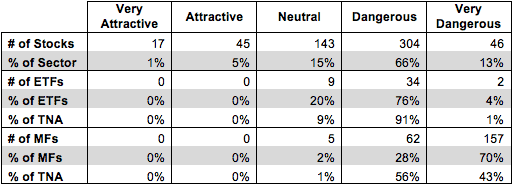 Sources: New Constructs, LLC and company filings
As detailed in “Cheap Funds Dupe Investors”, the fund industry offers many cheap funds but very few funds with high-quality stocks, or with what I call good portfolio management.
Investors need to tread carefully when considering Financials ETFs and mutual funds, as none of the ETFs and Financials mutual funds in the Financials sector allocate enough value to Attractive-or-better-rated stocks to earn an Attractive rating. With so many Dangerous rated ETFs and mutual funds, and no Attractive rated ones, investors would be better off by focusing on individual stocks instead.
W.R. Berkley Corp (WRB) is one of my favorite stocks held by Financials ETFs and mutual funds and earns my Very Attractive rating. Since the financial crisis in 2008, WRB has grown after-tax profits (NOPAT) by 20%, compounded annually. During that timeframe it has increased its return on invested capital (ROIC) from 6% to 11%. Economic earnings have also grown from ~$23 million in 2009 to ~$210 million last year. Despite its solid recovery, the market still prices WRB at a significant discount. At the current price of ~$42, WRB has a price to economic book value ratio of 0.8, implying a permanent 20% decline in NOPAT. Even including the financial crisis, WRB was able to grow NOPAT by 12%, compounded annually for the past 10 years. The market’s expectation seems awfully pessimistic in light of WRB’s track record of profit growth.
Doral Financial Corp (DRL) is one of my least favorite stocks held by Financials ETFs and mutual funds and earns my Very Dangerous rating. DRL has earned a negative NOPAT for the past six years. If one just looks at GAAP net income, DRL came closer to profitability in 2012 than it had at any point in those six years. However, the improvement was due solely to an unusual income tax benefit. If we adjust for non-operating taxes, DRL’s loss actually tripled from 2011 to 2012. Given the company’s current struggles, it is still overvalued even with a market cap of only ~$100 million. With no signs of returning to profitability, DRL only has value if someone swoops in to buy assets off its balance sheet. However, as long as the company keeps burning cash, the value of its assets will keep decreasing.
574 stocks of the 3000+ I cover are classified as Financials stocks, but due to style drift, Financials ETFs and mutual funds hold 696 stocks.
Figures 4 and 5 show the rating landscape of all Financials ETFs and mutual funds.
My Sector Rankings for ETFs and Mutual Funds report ranks all sectors and highlights those that offer the best investments.
Figure 4: Separating the Best ETFs From the Worst ETFs
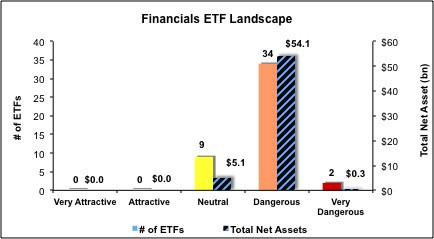 Sources: New Constructs, LLC and company filings
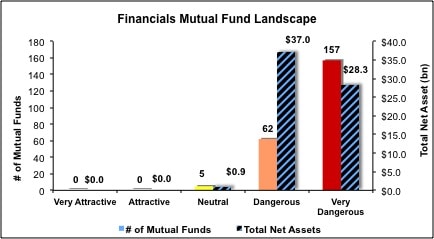
Figure 5: Separating the Best Mutual Funds From the Worst Mutual Funds
 Sources: New Constructs, LLC and company filings
Review my full list of ratings and rankings along with reports on all 45 ETFs and 224 mutual funds in the Financials sector.
Kyle Guske II contributed to this report
Disclosure: David Trainer owns WRB. David Trainer and Kyle Guske II receive no compensation to write about any specific stock, sector or theme.