
Wall Street analysts are too bullish on fourth quarter earnings expectations for most S&P 500 companies. Although down from record highs set in recent quarters, the percentage of S&P 500 companies whose Street EPS exceeds our Core EPS[1] remains high at 68%.
This report shows:
- the frequency and magnitude of overstated Street Earnings[2] in the S&P 500
- five S&P 500 companies with overstated Street estimates likely to miss 4Q22 earnings
Get our report on the S&P 500 companies most likely to beat 4Q22 Street EPS estimates here.
Street Overstates EPS for 339 S&P 500 Companies
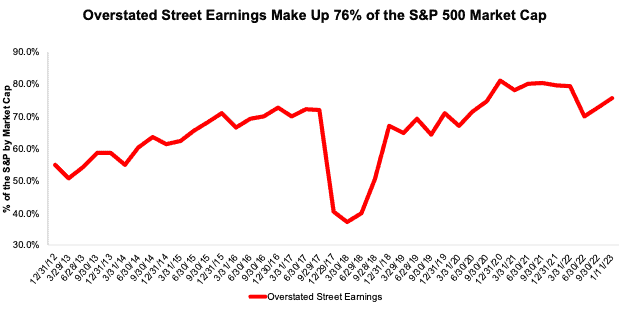
339 companies with overstated Street Earnings in 3Q22 make up 76% of the S&P 500 market cap as of 1/11/23, measured on a rolling four quarter basis. For comparison, 341 companies representing 73% of the S&P 500 market cap had overstated Street Earnings in the TTM ended 2Q22.
Figure 1: Overstated Street Earnings as % of Market Cap: 2012 through 1/11/23
Sources: New Constructs, LLC and company filings.
When Street Earnings overstate Core Earnings, they do so by an average of 19%. See Figure 2. For over a third of the S&P 500 (186 companies), Street Earnings overstate Core Earnings by more than 10%.
Figure 2: Street Earnings Overstated by 19% on Average in TTM Through 3Q22[3]

Sources: New Constructs, LLC and company filings.
Five S&P 500 Companies Likely to Miss 4Q22 Earnings
Figure 3 shows five S&P 500 companies likely to miss calendar 4Q22 earnings because their Street EPS estimates are overstated. Below, we detail the hidden and reported unusual items that caused Street Distortion and overstated Street Earnings in the TTM ended 3Q22 for Tesla Inc. (TSLA). Because investors and analysts tend to anchor their earnings projections to historical results, errors in historical Street EPS lead to errors in Street EPS estimates.
Figure 3: Five S&P 500 Companies Likely to Miss 4Q22 EPS Estimates
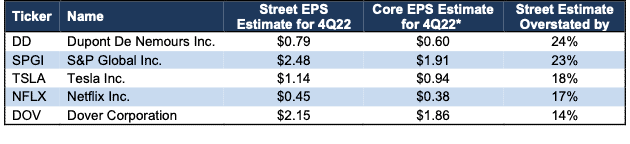
Sources: New Constructs, LLC, company filings, and Zacks
*Assumes Street Distortion as a percent of Core EPS is same for 4Q22 EPS as for TTM ended 3Q22.
Tesla Inc.: The Street Overstates Earnings for 4Q22 by 18%
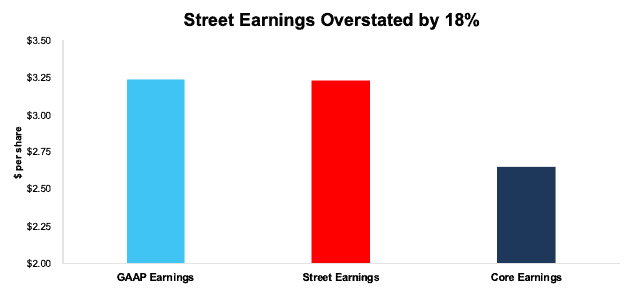
The Street’s 4Q22 EPS estimate of $1.14/share for Tesla overstates our estimate for 4Q22 Core EPS of $0.94/share by $0.20/share. Large gains due to regulatory credits and “other income” drive the difference between Street and Core EPS estimates. As a long-standing Danger Zone pick with a 'Strong Miss' Earnings Distortion Score, Tesla is one of the S&P 500 companies we consider most likely to miss Wall Street’s estimates. See our latest report on why the stock remains significantly overvalued here.
Below we detail the unusual gains that materially boost and distort Tesla’s TTM 3Q22 Street and GAAP earnings. After removing all unusual items, we find that Tesla’s TTM 3Q22 Core EPS are $2.65/share, which is worse than TTM 3Q22 Street EPS of $3.23/share and GAAP EPS of $3.24/share.
Figure 4: Comparing Tesla’s GAAP, Street, and Core Earnings: TTM Through 3Q22
Sources: New Constructs, LLC and company filings.
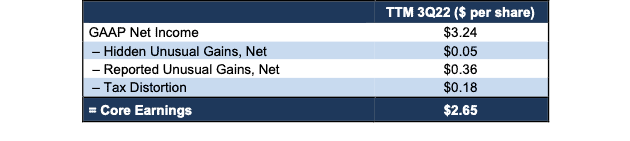
Figure 5 shows the differences between Tesla’s Core Earnings and GAAP Earnings so readers can audit our research. We would be happy to reconcile our Core Earnings with Street Earnings but cannot because we do not have the details on how analysts calculate their Street Earnings.
Figure 5: Tesla’s GAAP Earnings to Core Earnings Reconciliation: TTM Through 3Q22
Sources: New Constructs, LLC and company filings.
More details:
Total Earnings Distortion of $0.59/share, which equals $2.0 billion, is comprised of the following:
Hidden Unusual Gains, Net = $0.05/per share, which equals $184 million and is comprised of
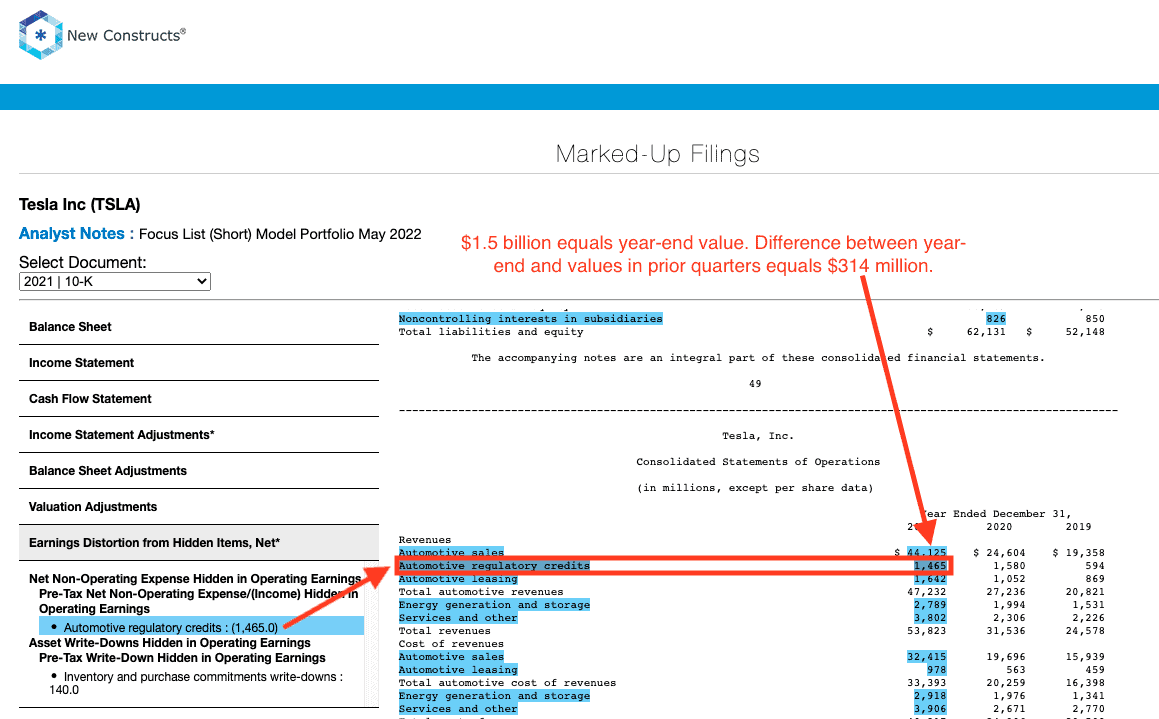
- $314 million in automotive regulatory credits in 4Q21[4]
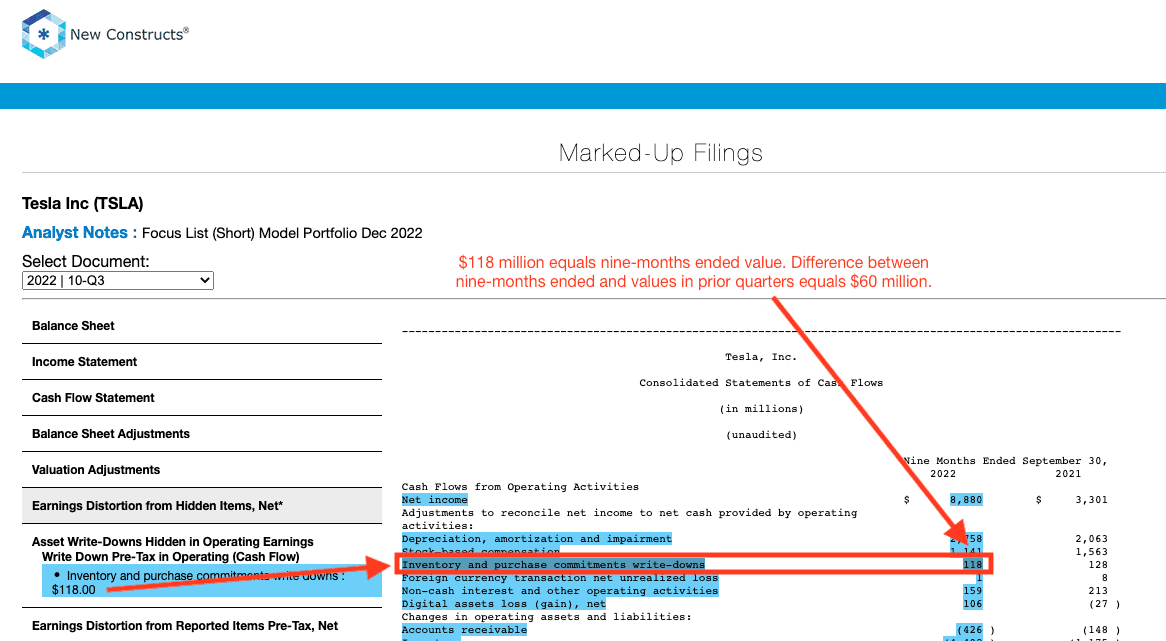
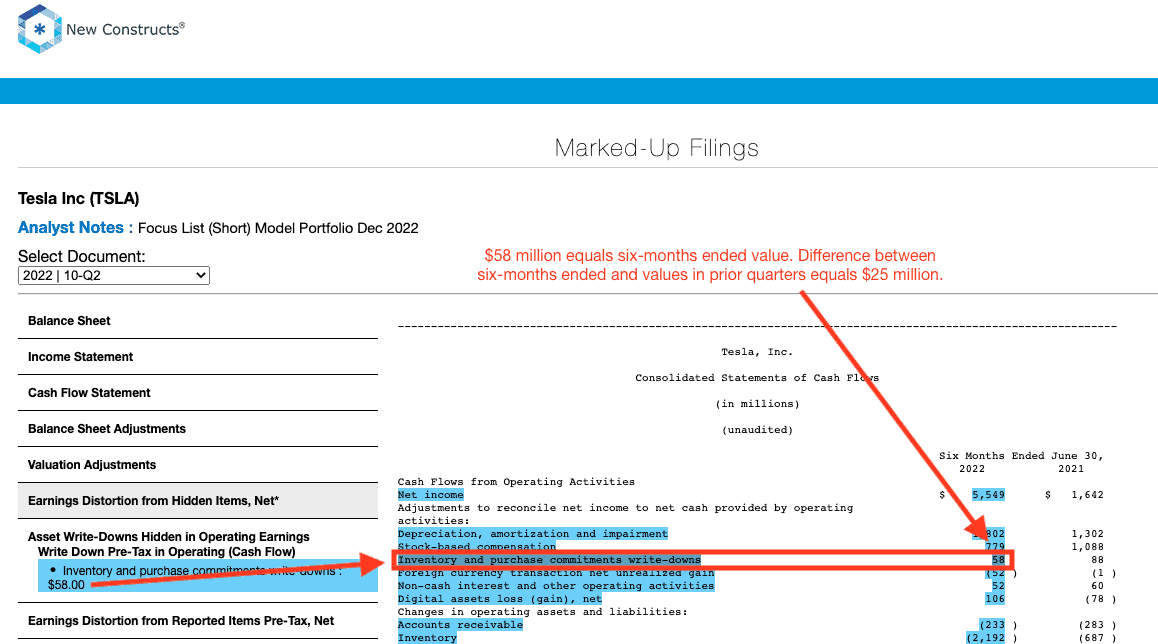
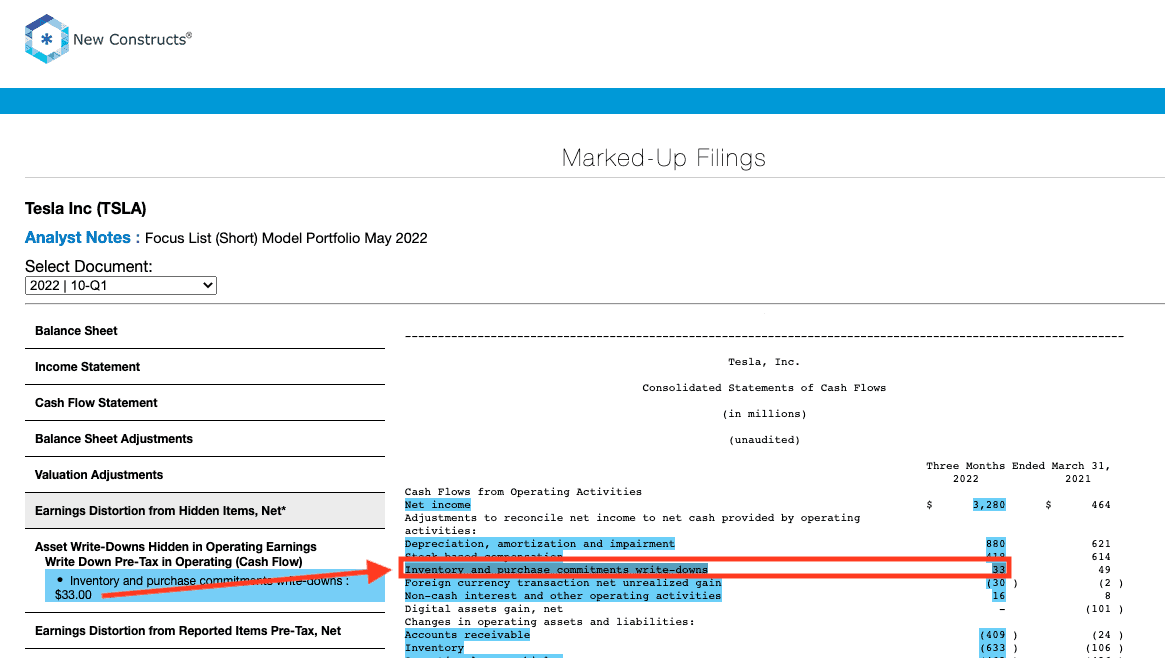
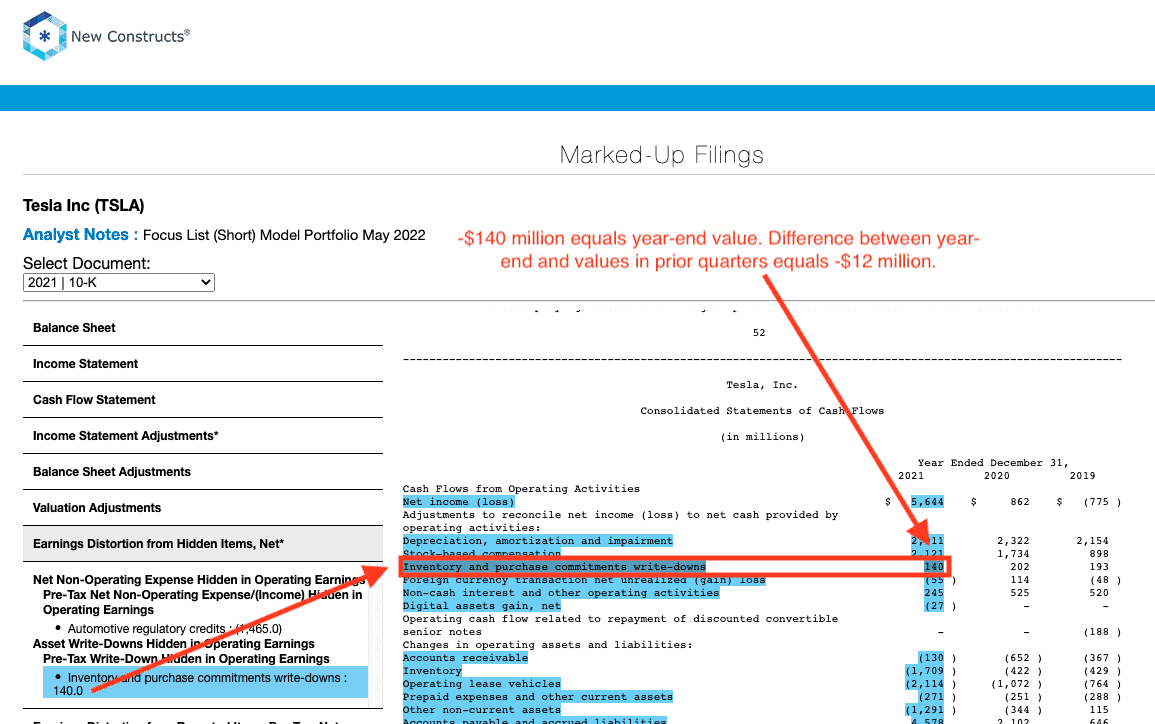
- -$130 million in inventory and purchase commitment write-downs in the TTM period based on
- -$60 million in 3Q22
- -$25 million in 2Q22
- -$33 million in 1Q22
- -$12 million in 4Q21
Reported Unusual Gains, Net = $0.36/per share, which equals $1.2 billion and is comprised of
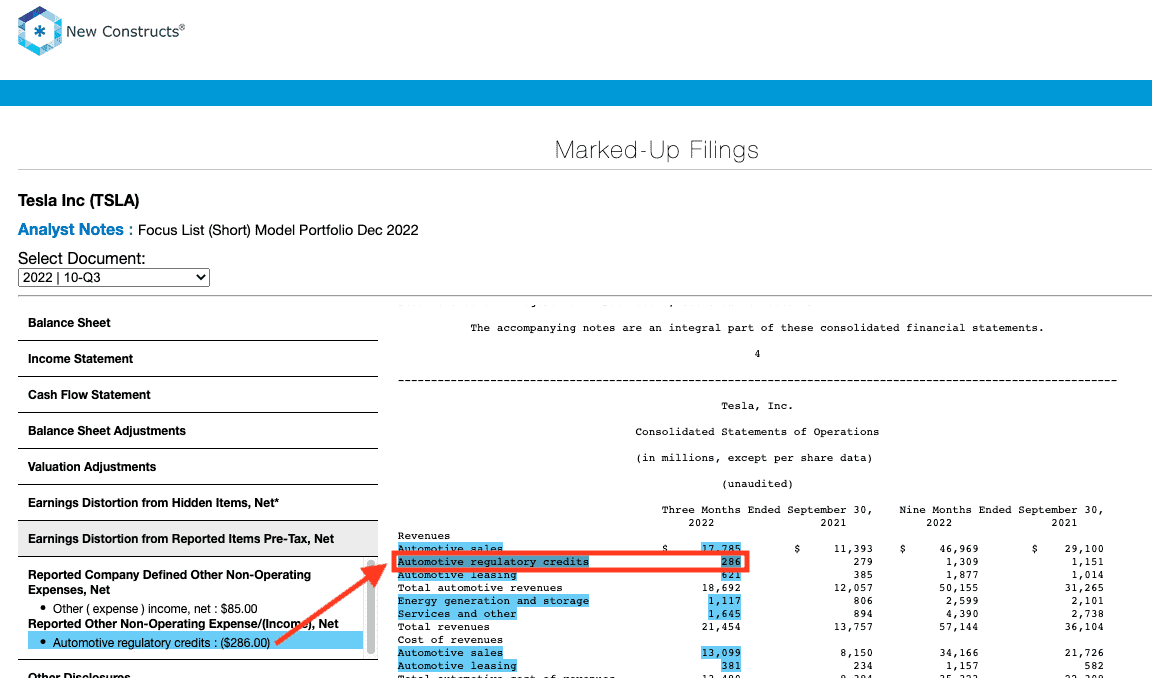
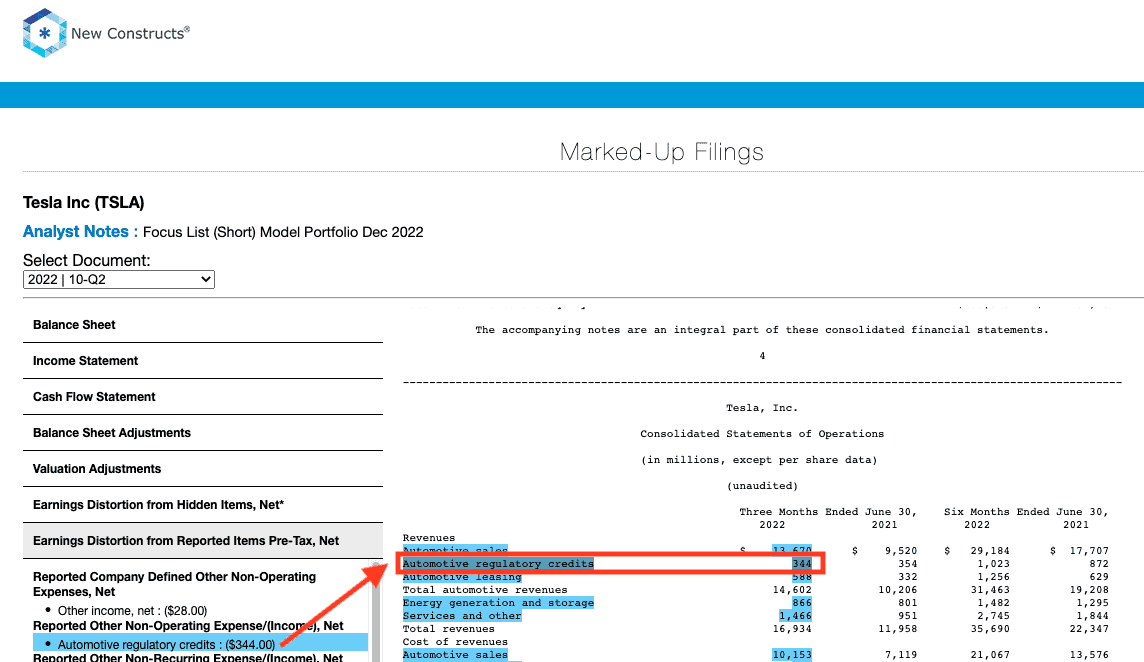
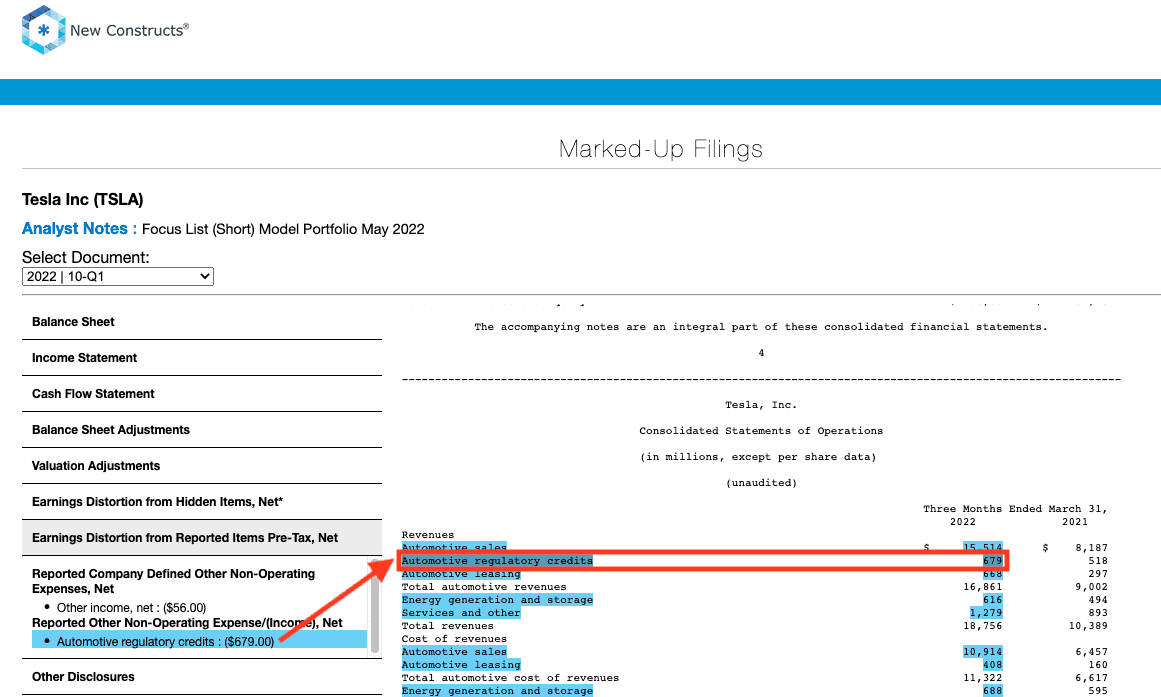
- $1.3 billion in automotive regulatory credits[5] in the TTM period based on
- $286 million in 3Q22
- $344 million in 2Q22
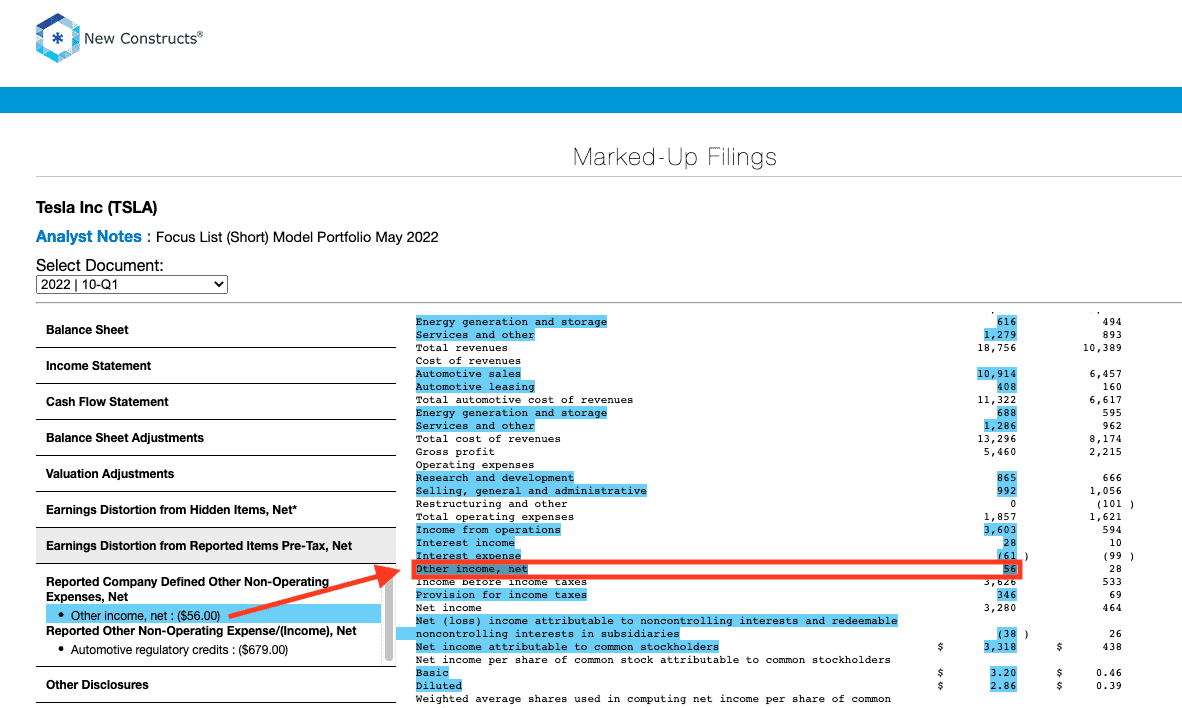
- $679 million in 1Q22
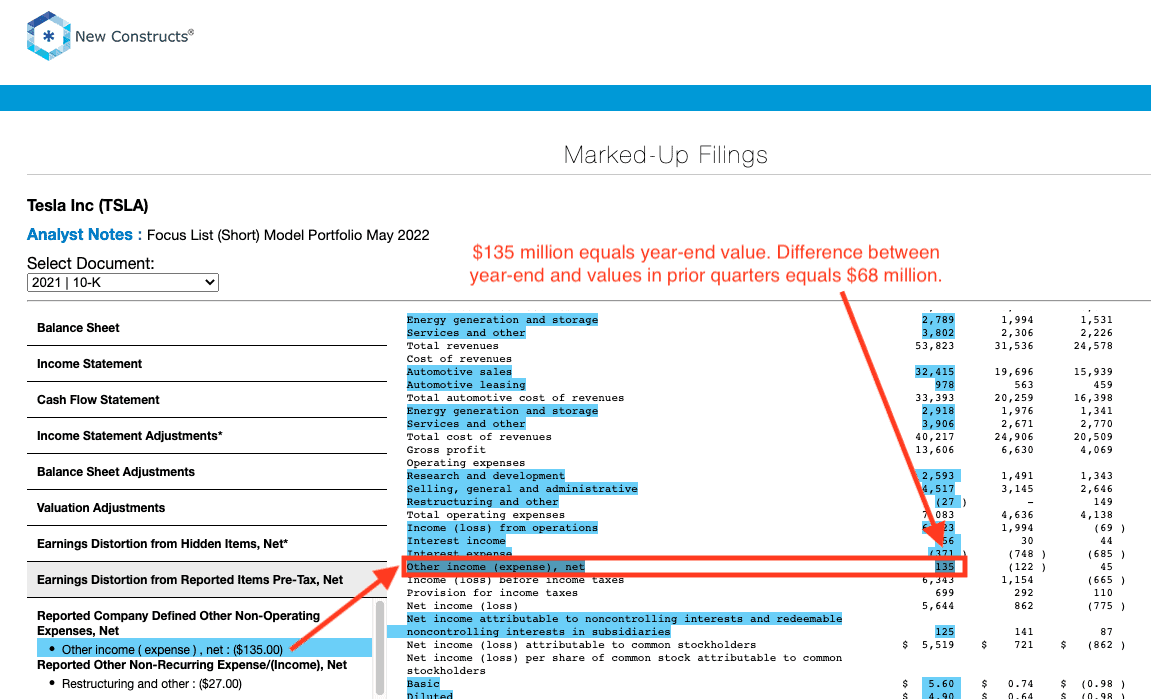
- $68 million income in 4Q21
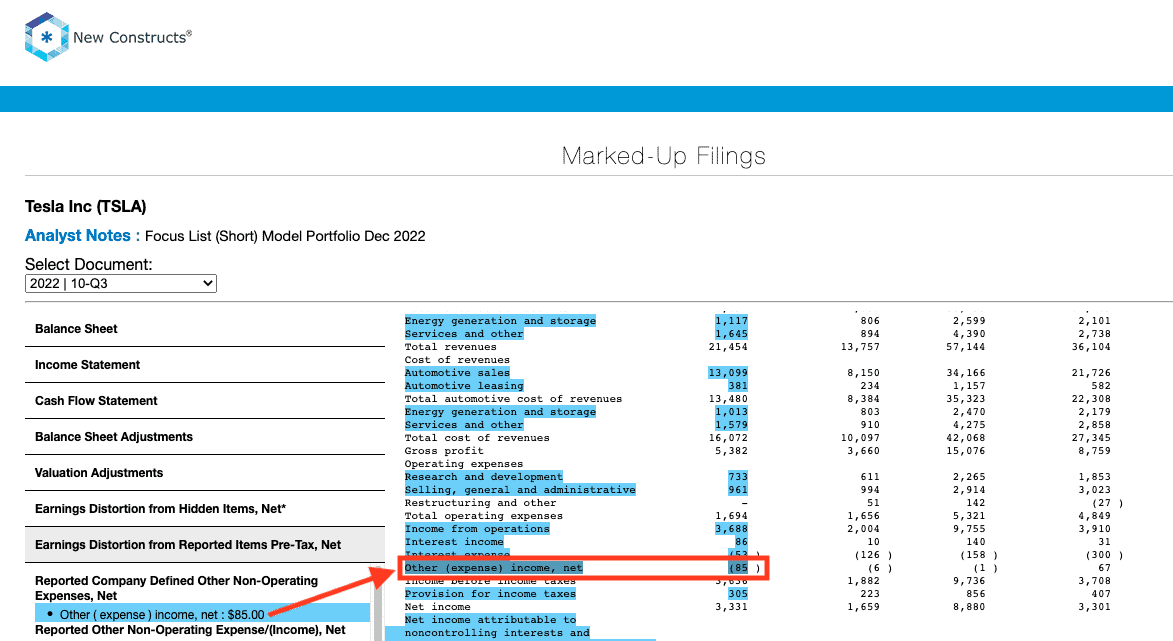
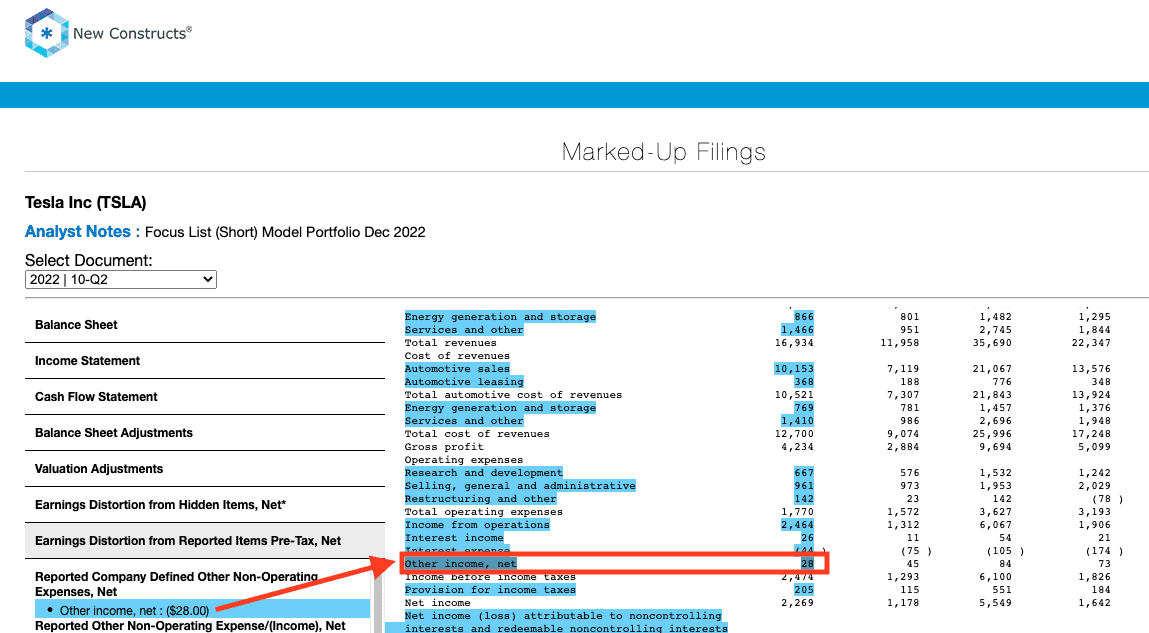
- $67 million in other income in the TTM period based on
- -$85 million expense in 3Q22
- $28 million income in 2Q22
- $56 million income in 1Q22
- $68 million income in 4Q21
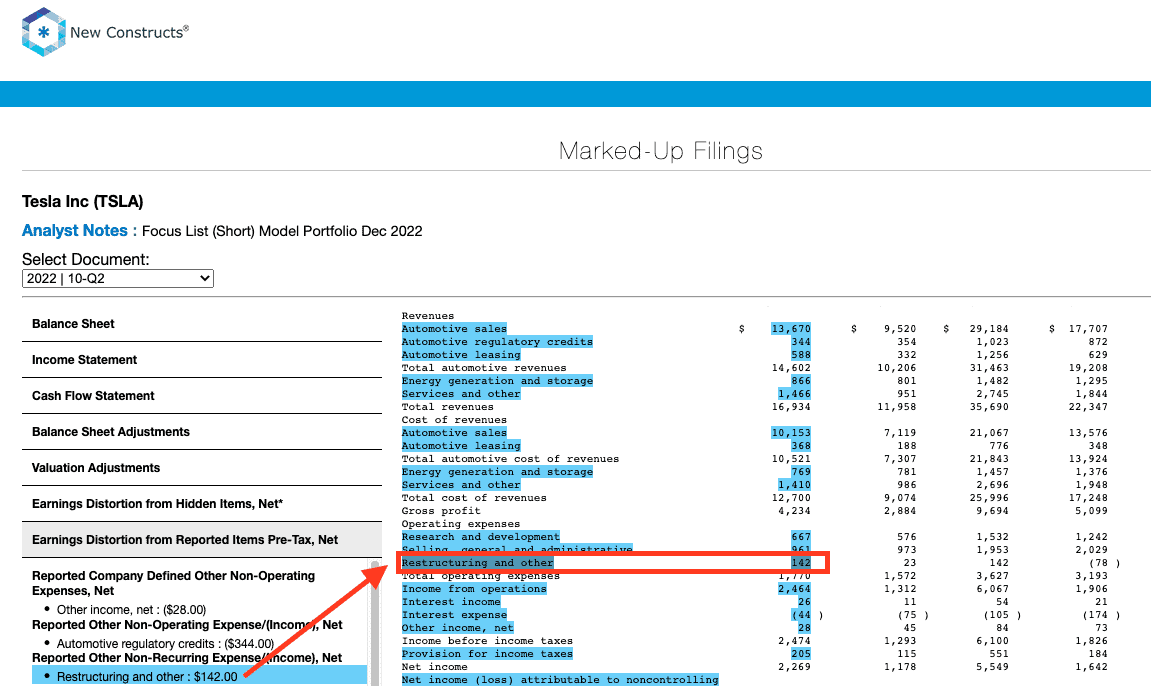
- -$142 million in restructuring and other expense in the TTM period based on
- -$142 million in 2Q22
Tax Distortion = $0.18/per share, which equals $612 million
The similarities between Street and GAAP Earnings for Tesla indicate that Street Earnings overlook many of the same unusual items as GAAP Earnings. Core Earnings are a more comprehensive measure of profits and capture all unusual items to ensure we calculate Tesla’s true profitability.
This article was originally published on January 12, 2023.
Disclosure: David Trainer, Kyle Guske II, Matt Shuler, and Italo Mendonça receive no compensation to write about any specific stock, style, or theme.
Follow us on Twitter, Facebook, LinkedIn, and StockTwits for real-time alerts on all our research.
[1] The Journal of Financial Economics features the superiority of our Core Earnings in Core Earnings: New Data & Evidence.
[2] Street Earnings refer to Zacks Earnings, which are reported to remove non-recurring items using standardized assumptions from the sell-side.
[3] Average overstated % is calculated as Street Distortion, which is the difference between Street Earnings and Core Earnings.
[4] We treat the automotive regulatory credits as hidden in 4Q21 due to how Tesla disclosed them in prior quarters. While Tesla moved this line item to the Income Statement in its 2021 10-K, the credits were not disclosed on the income statement but in a separate table that broke down Tesla’s revenue by source in the 2021 10-Q. Therefore, we must use both values to calculate the 4Q21 amount.
[5] We treat the automotive regulatory credits as reported items in the 2022 10-Qs because they are reported directly on the income statement. In prior quarters, these credits were only disclosed in a table separate from the Income Statement, which is why we treated them as Hidden in past periods.