
Despite a turbulent first half of the year, investor sentiment appears fairly optimistic heading into the 2Q25 earnings season. Bitcoin’s rally above $113,000 and a strong showing from tech stocks have buoyed markets for what may be a positive week of earnings reports.
However, this recent confidence seems more speculative than rooted in fundamentals. A lot of uncertainties remain, and headlines continue to drive stock prices. In an environment where Wall Street not only sets earnings estimates but also frames the conversation around “beats” and “misses,” it becomes even more critical to separate signal from noise.
True analysis into a company’s economic condition requires disciplined research. Investors can’t stop at “adjusted” metrics or polished presentations. No, they must dig into the fine print of filings, including the often-overlooked footnotes where crucial details hide.
That’s how we conduct our analysis: rigorous, detail-oriented, and anchored in economic reality. The result? Research that not only withstands volatility, but also consistently generates novel alpha.
For example, we recently identified five stocks most likely to beat 2Q25 earnings and five stocks most likely to miss 2Q25 earnings. Be sure to check out the recent training, which details how we identified these stocks in preparation for the upcoming earnings season.
And, as usual, we are featuring a stock from our Most Dangerous Stocks Model Portfolio, which was created to help investors steer clear of danger. This Model Portfolio highlights the worst of the worst, the stocks with poor fundamentals and excessive valuations, so you can avoid them with confidence.
This free stock feature provides a summary of how we pick stocks for this Model Portfolio. It is not a full Danger Zone report, but it provides insight into the rigor of our research and approach to picking stocks. Whether you’re a subscriber or not, we think it is important that you’re able to see our research on stocks on a regular basis.
We’re proud to share our work. Please feel free to share it with your friends and family.
Keep an eye out for the free pick from our Most Attractive Stocks Model Portfolio, which will be published this week as well! The work that goes into that report is just as valuable.
We update this Model Portfolio monthly. The latest Most Attractive and Most Dangerous stocks Model Portfolios were updated and published for clients on July 2, 2025.
Free Most Dangerous Stock Pick: Axon Enterprise Inc. (AXON)
Axon Enterprise’s (AXON: $806/share) net operating profit after tax (NOPAT) margin fell from 13% in 2014 to 2% in the TTM, while the company’s invested capital turns fell from 2.7 to 1.0 over the same time. Falling NOPAT margins and invested capital turns drive Axon Enterprise’s return on invested capital (ROIC) from 35% in 2014 to 2% in the TTM.
Axon Enterprise’s economic earnings, the true cash flows of the business, fell from -$22 million in 2019 to -$173 million in the TTM. Meanwhile, the company’s GAAP net income rose from $1 million to $332 million over the same time. Whenever GAAP earnings rise while economic earnings decline, investors should beware.
Figure 1: Axon’s Economic vs GAAP Earnings Since 2019
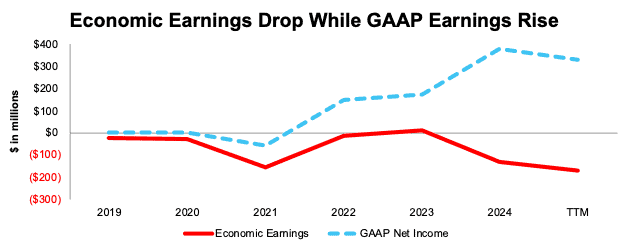
Sources: New Constructs, LLC and company filings
AXON Provides Poor Risk/Reward
Despite its poor and declining fundamentals, Axon Enterprise’s stock is priced for significant profit growth, and we believe the stock is overvalued.
To justify its current price of $806/share, Axon Enterprise must immediately improve its NOPAT margin to 19% (equal to record high in 2004 compared to 2% in the TTM) and grow revenue by 38% compounded annually through 2034 (above the company’s ten-year CAGR of 29%). In this scenario, Axon Enterprise’s implied NOPAT would equal $10.1 billion in 2034, which is significantly higher than the company’s record NOPAT of $124 million in 2023. Contact us for the math behind this reverse DCF scenario. We think these expectations are overly optimistic.
Even if Axon Enterprise improves its NOPAT margin to 19% and grows revenue 29% (equal to ten-year CAGR) compounded annually through 2034, the stock would be worth no more than $432/share today – a 46% downside to the current stock price. Contact us for the math behind this reverse DCF scenario.
Each of these scenarios also assumes Axon Enterprise can grow revenue, NOPAT, and FCF without increasing working capital or fixed assets. This assumption is unlikely but allows us to create best case scenarios that demonstrate the high expectations embedded in the current valuation.
Critical Details Found in Financial Filings by Our Robo-Analyst Technology
Below are specifics on the adjustments we made based on Robo-Analyst findings in Axon Enterprise’s 10-K and 10-Q:
Income Statement: we made under $400 million in adjustments, with a net effect of removing over $300 million in non-operating income. Professional members can see all adjustments made to the company’s income statement on the GAAP Reconciliation tab on the Ratings page on our website.
Balance Sheet: we made over $2 billion in adjustments to calculate invested capital with a net decrease of just over $1 billion. One of the most notable adjustments was for deferred tax assets. Professional members can see all adjustments made to the company’s balance sheet on the GAAP Reconciliation tab on the Ratings page on our website.
Valuation: we made over $4 billion in adjustments to shareholder value, with a net increase of just under $200 million. The most notable adjustment to shareholder value was for excess cash. Professional members can see all adjustments to the company’s valuation on the GAAP Reconciliation tab on the Ratings page on our website.
This article was originally published on July 11, 2025.
Disclosure: David Trainer, Kyle Guske II, and Hakan Salt receive no compensation to write about any specific stock, style, or theme.
Questions on this report or others? Join our online community and connect with us directly.