
While the war in the Middle East has seemingly calmed down, the trade war is picking back up. The tension between the U.S. and China is escalating by the day. In the meantime, the U.S. government has been shut down for more than two weeks now, bringing agencies such as the Federal Aviation Administration (FAA), Department of Health and Human Services (HHS), the Internal Revenue Services (IRS), and The National Institutes of Health (NIH) to a standstill.
During times when it’s impossible to predict what will happen, it is possible to be prepared for the unexpected. Investors can sleep easier at night during these volatile times when they know the true fundamentals of the companies in their portfolio, as well as the expectations for future profits baked into stock prices.
For investors that want peace of mind, we created the Most Dangerous Stocks Model Portfolio. This Model Portfolio highlights the worst of the worst, the stocks with poor fundamentals and excessive valuations, so you can avoid them with confidence. To illustrate the level of risk these stocks present, we are featuring a stock from this Model Portfolio.
This free stock feature provides a summary of how we pick stocks for this Model Portfolio. It is not a full Danger Zone report, but it provides insight into the rigor of our research and approach to picking stocks. Whether you’re a subscriber or not, we think it is important that you’re able to see our research on stocks on a regular basis.
We’re proud to share our work. Please feel free to share it with your friends and family.
Keep an eye out for the free pick from our Most Attractive Stocks Model Portfolio, which will be published this week as well! The work that goes into that report is just as valuable.
We update this Model Portfolio monthly. The latest Most Attractive and Most Dangerous stocks Model Portfolios were updated and published for clients on October 3, 2025.
Free Most Dangerous Stock Pick: Kratos Defense & Security Solutions Inc. (KTOS)
Kratos’ (KTOS: $91/share) net operating profit after tax (NOPAT) margin fell from 5% in 2019 to 1% in the TTM, while the company’s invested capital turns increased from 0.6 to 0.7 over the same time. Falling NOPAT margins more than offset rising invested capital turns and drive Kratos’ return on invested capital (ROIC) from 3% in 2019 to 1% in the TTM.
Kratos’ economic earnings, the true cash flows of the business, fell from -$45 million in 2019 to -$141 million in the TTM. Meanwhile, the company’s GAAP net income, despite fluctuations, actually improved from $13 million to $15 million over the same time. Whenever GAAP earnings rise while economic earnings decline, investors should beware.
Figure 1: Kratos’ Economic vs GAAP Earnings Since 2019
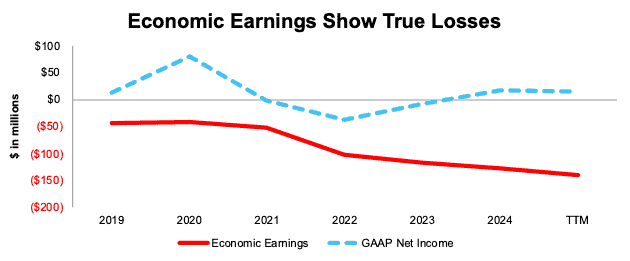
Sources: New Constructs, LLC and company filings
KTOS Provides Poor Risk/Reward
Despite its poor and declining fundamentals, Kratos’ stock is priced for significant profit growth, and we believe the stock is overvalued.
To justify its current price of $91/share, Kratos must immediately improve its NOPAT margin to 15% (far above its best-ever margin of 6% in 2011 and TTM margin of 1%) and grow revenue by 30% compounded annually through 2034 (compared to ten-year revenue CAGR of 3%). In this scenario, Kratos’ NOPAT would grow 58% compounded annually through 2034. For reference, Kratos’ NOPAT has fallen by 10% and 3% compounded annually over the last five and ten years, respectively. Contact us for the math behind this reverse DCF scenario. We think these expectations look overly optimistic.
Even if Kratos improves its NOPAT margin to 10% and grows revenue 25% compounded annually through 2034, the stock would be worth no more than $46/share today – a 49% downside to the current stock price. Contact us for the math behind this reverse DCF scenario.
Each of these scenarios also assumes Kratos can grow revenue, NOPAT, and FCF without increasing working capital or fixed assets. This assumption is unlikely but allows us to create best case scenarios that demonstrate the high expectations embedded in the current valuation.
Critical Details Found in Financial Filings by Our Robo-Analyst Technology
Below are specifics on the adjustments we made based on Robo-Analyst findings in Kratos’ 10-K and 10-Q:
Income Statement: we made around $10 million in adjustments, with a net effect of removing over $5 million in non-operating expense. Professional members can see all adjustments made to the company’s income statement on the GAAP Reconciliation tab on the Ratings page on our website.
Balance Sheet: we made just over $700 million in adjustments to calculate invested capital with a net decrease of under $50 million. One of the most notable adjustments was for asset write downs. Professional members can see all adjustments made to the company’s balance sheet on the GAAP Reconciliation tab on the Ratings page on our website.
Valuation: we made just over $1 billion in adjustments to shareholder value, with a net increase of over $400 million. The most notable adjustment to shareholder value was for excess cash. Professional members can see all adjustments to the company’s valuation on the GAAP Reconciliation tab on the Ratings page on our website.
This article was originally published on October 17, 2025.
Disclosure: David Trainer, Kyle Guske II, and Hakan Salt receive no compensation to write about any specific stock, style, or theme.
Questions on this report or others? Join our online community and connect with us directly.