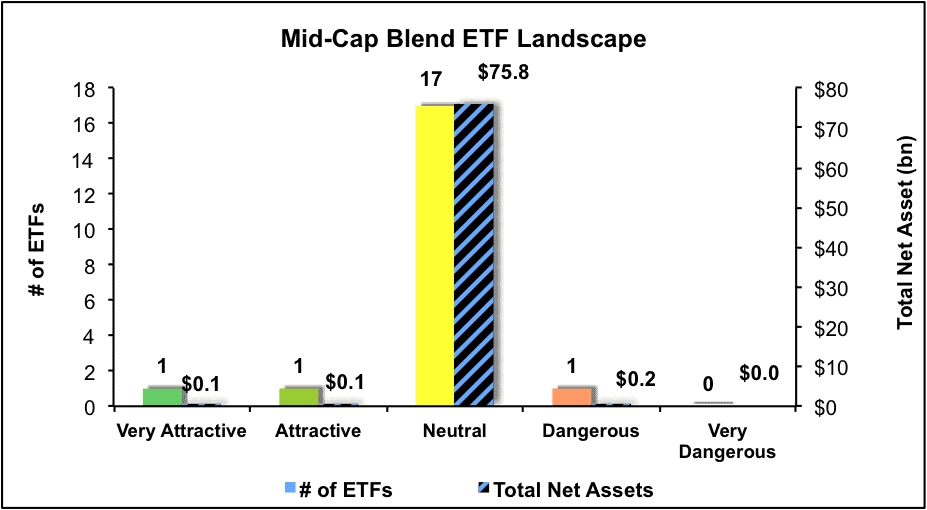
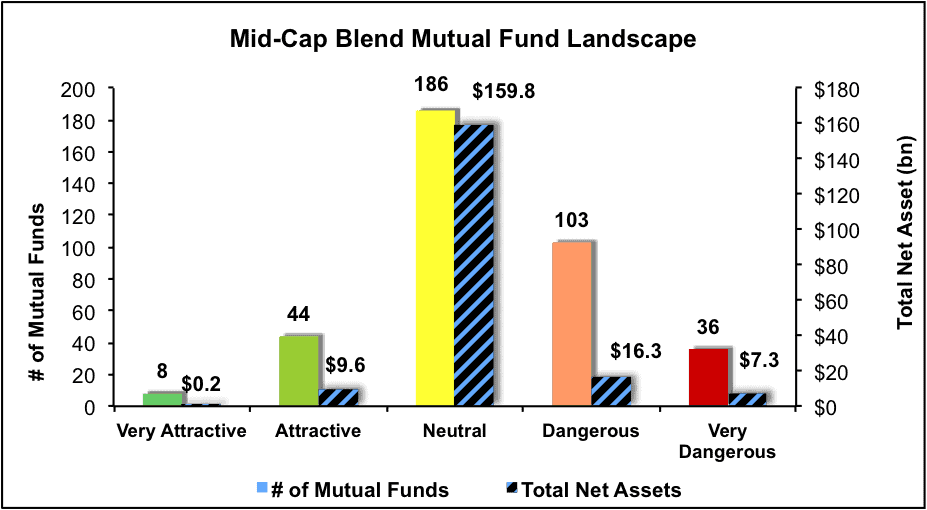
The Mid Cap Blend style ranks fifth out of the twelve fund styles as detailed in our 2Q16 Style Ratings for ETFs and Mutual Funds report. Last quarter, the Mid Cap Blend style ranked sixth. It gets our Neutral rating, which is based on aggregation of ratings of 20 ETFs and 377 mutual funds in the Mid Cap Blend style as of May 4, 2016. See a recap of our 1Q16 Style Ratings here.
Figures 1 and 2 show the five best and worst rated ETFs and mutual funds in the style. Not all Mid Cap Blend style ETFs and mutual funds are created the same. The number of holdings varies widely (from 14 to 3281). This variation creates drastically different investment implications and, therefore, ratings.
Investors seeking exposure to the Mid Cap Blend style should buy one of the Attractive-or-better rated ETFs or mutual funds from Figures 1 and 2.
Figure 1: ETFs with the Best & Worst Ratings – Top 5

* Best ETFs exclude ETFs with TNAs less than $100 million for inadequate liquidity.
Sources: New Constructs, LLC and company filings
Five ETFs are excluded from Figure 1 because total net assets (TNA) are below $100 million and do not meet our liquidity minimums. See our ETF screener for more details.
Figure 2: Mutual Funds with the Best & Worst Ratings – Top 5
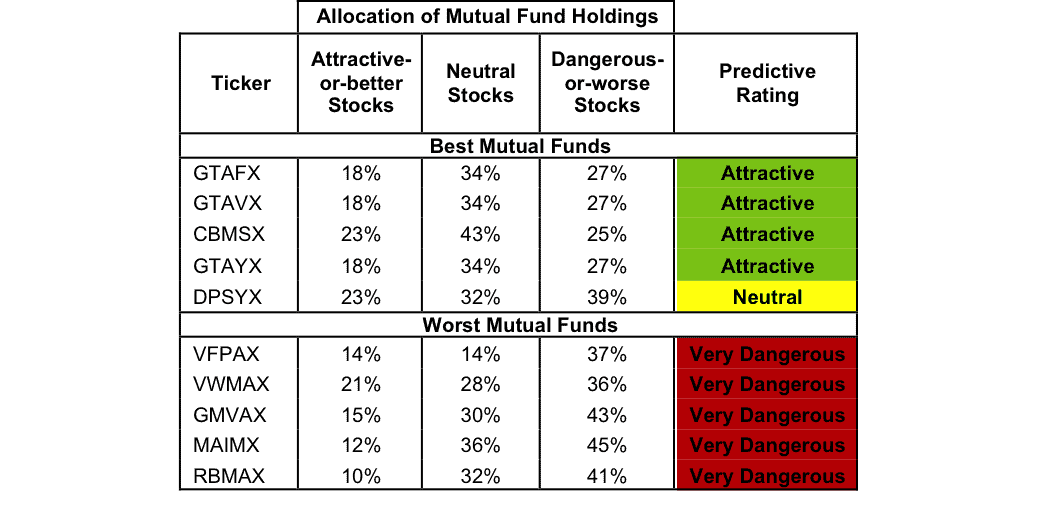
* Best mutual funds exclude funds with TNAs less than $100 million for inadequate liquidity.
Sources: New Constructs, LLC and company filings
Five mutual funds are excluded from Figure 2 because their total net assets (TNA) are below $100 million and do not meet our liquidity minimums. See our mutual fund screener for more details.
PowerShares S&P MidCap Low Volatility Portfolio (XMLV) is the top-rated Mid Cap Blend ETF and Invesco Mid Cap Core Equity Fund (GTAFX) is the top-rated Mid Cap Blend mutual fund. XMLV earns a Neutral rating and GTAFX earns an Attractive rating.
Guggenheim Raymond James SB-1 Equity ETF (RYJ) is the worst rated Mid Cap Blend ETF and RBC Mid Cap Value Fund (RBMAX) is the worst rated Mid Cap Blend mutual fund. RYJ earns a Dangerous rating and RBMAX earns a Very Dangerous rating.
Torchmark Corporation (TMK: $58/share) is one of our favorite stocks held by GTAFX and earns an Attractive rating. Torchmark may not be flashy, but it has been consistent in growing profits. Since 1998, Torchmark has grown after-tax profit (NOPAT) by 4% compounded annually. The company has earned a double-digit return on invested capital (ROIC) every year since 1998 and currently earns a 13% ROIC. Torchmark has also generated positive free cash flow in 17 of the past 18 years with a cumulative $3 billion over the last five years alone. Despite this operational success, TMK remains undervalued. At its current price of $58/share, Torchmark has a price-to-economic book value (PEBV) ratio of 1.0. This ratio means that the market expects Torchmark’s NOPAT never to meaningfully grow from its current levels. If Torchmark can grow NOPAT by just 4% compounded annually for the next decade, the stock is worth $73/share today – a 26% upside.
United States Cellular Corp (USM: $43/share) is one of our least favorite stocks held by RYJ and earns a Dangerous rating. Since 2006, United States Cellular’s NOPAT has declined by 4% compounded annually. Its ROIC has fallen from an already low 5% in 2006 to a bottom-quintile 2% over the last twelve months. Worst of all, USM has never generated positive economic earnings in any year of our model, which dates to 1998. The market has ignored the deterioration of the business and USM is overvalued. To justify its current price, United States Cellular must grow NOPAT by 9% compounded annually for the next 16 years. Given years of profit decline, this expectation seems overly optimistic.
Figures 3 and 4 show the rating landscape of all Mid Cap Blend ETFs and mutual funds.
Figure 3: Separating the Best ETFs From the Worst Funds
Sources: New Constructs, LLC and company filings
Figure 4: Separating the Best Mutual Funds From the Worst Funds
Sources: New Constructs, LLC and company filings
Disclosure: David Trainer and Kyle Guske II receive no compensation to write about any specific stock, style, or theme.