
Why pay fees to an ETF issuer just to bundle some stocks together?
It’s not like any issuers are putting together a magical list of stocks in an ETF that is dramatically outperforming the market over any meaningful amount of time.
Unspoken Truth
ETFs are charging you a fee for a service that adds no value and that you can easily perform on your own.
So, I’ll ask again – why pay fees to ETFs for something you can do on your own and do with better research?
Our Do-It-Yourself ETF
We think the days of paying fees for ETF issuers or mutual fund managers to pick stocks are ending because
- investors do not get any value for the fees they pay and
- new technology makes it easy for investors to build their own ETF, without fees and based on proven superior research.
This idea isn’t hypothetical. Pro and Institutional members already have access to this technology on the Portfolios page. We call it the DIY ETF. See Figure 1.
The DIY ETF tool gives clients the ability to create a custom basket of stocks, ETFs and/or mutual funds and weight them according to our alpha-generating data and metrics.
Figure 1: New Constructs DIY ETF Tool
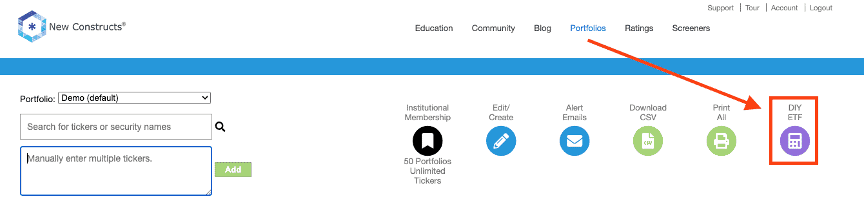
Sources: New Constructs, LLC and company filings.
Once clients have finalized the stocks they want in their fund and how their want to weight the stocks, they can, with one click, download a standard order form for any broker to buy the stocks to create their custom fund.
Figure 2 shows where to access key features on the DIY ETF page:
- Enter any investment amount – our system automatically adjusts your order form for the amount of money you wish to allocate.
- Choose the weighting methodology – we offer 10+ metrics, including market cap, dividend yield, our proprietary Core Earnings or return on invested capital (ROIC), and your own custom weightings.
- Download Order Form – get a CSV file with every order needed to create the portfolio on the page. Click here for a sample.
Figure 2: How to Use the DIY ETF Tool
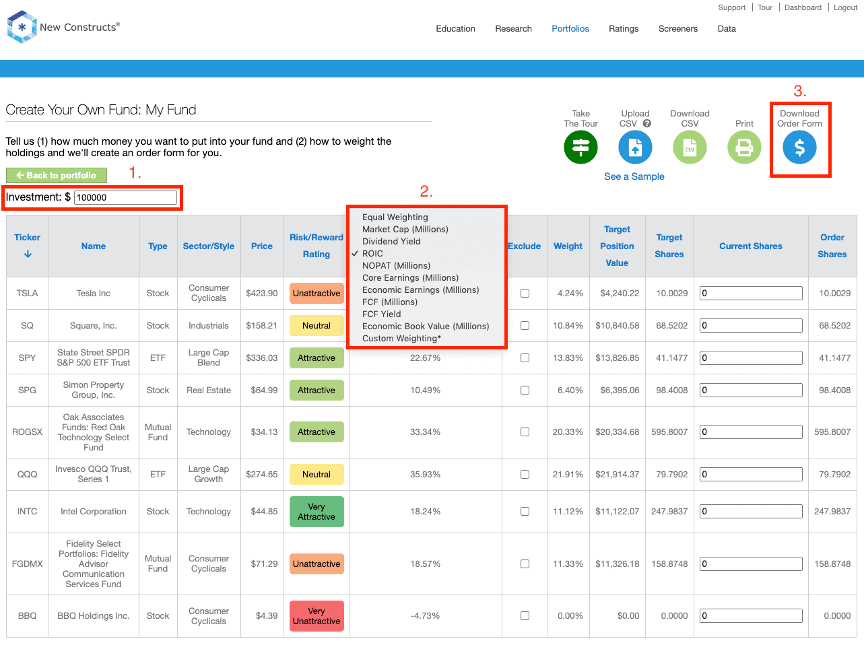
Sources: New Constructs, LLC and company filings.
Why DIY ETF?
Why would investors want to create their own ETF? Outperformance, of course.
When it comes to outperformance, we can deliver, and we can prove that we can deliver.
Three live-traded indices based on our Stock Ratings and Core Earnings research have outperformed the S&P 500 in 1H25 and over the past 5 years. These indices are provided by Bloomberg’s Index Licensing Group. Below are details on how you can look them up and see the outperformance for yourself.
Is there a better way to prove the alpha in our research than live, actively-traded indices that beat the market?
- Bloomberg New Constructs Core Earnings Leaders Index (ticker: BCORET:IND)
- Bloomberg New Constructs Ratings VA-1 Index (ticker: BNCVA1T:IND)
- Bloomberg New Constructs 500 Index (ticker: B500NCT:IND)
The Bloomberg New Constructs Core Earnings Leaders Index, which allocates based on Earnings Capture and Core Earnings, beat the S&P 500 by over 36% over the past five years. The Index (ticker: BCORET:IND) was up 125% while the S&P 500 was up 89%.
Figure 3: Bloomberg New Constructs Core Earnings Leaders Index Outperforms S&P 500: Last 5 Years
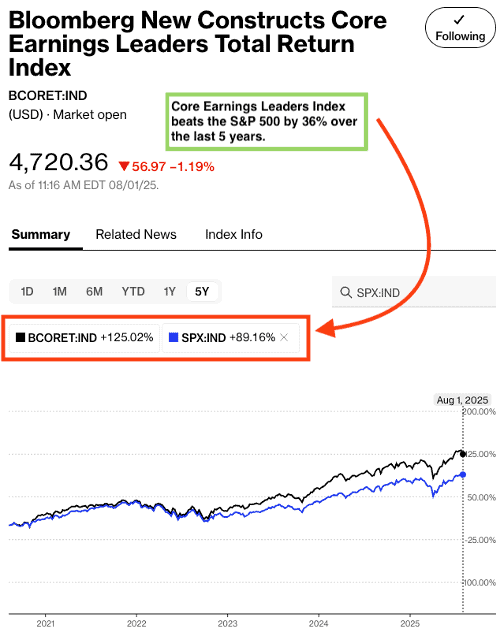
Sources: Bloomberg as of August 1, 2025
Note: Past performance is no guarantee of future results.
The “Very Attractive Stocks” Index, which allocates to stocks that get a Very Attractive rating by our AI Agent for Investing, beat the S&P 500 by 66% over the last five years. Bloomberg’s official name for the index is Bloomberg New Constructs Ratings VA-1Index (ticker: BNCVAT1T:IND). Figure 4 shows it was up 155% while the S&P 500 was up 89%.
Figure 4: Very Attractive-Rated Stocks Strongly Outperform the S&P 500: Last Five Years
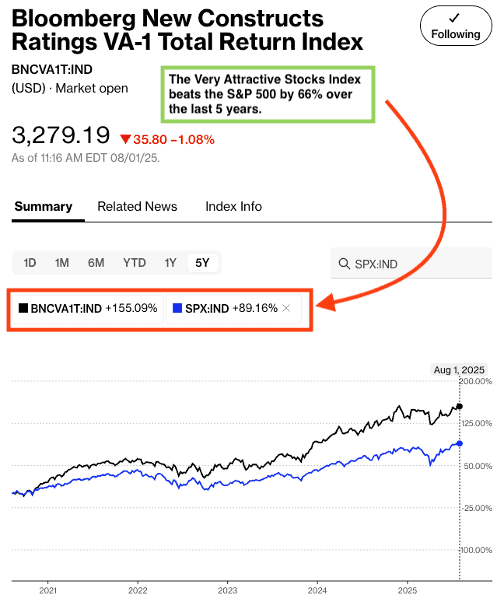
Sources: Bloomberg as of August 1, 2025
Note: Past performance is no guarantee of future results.
Our “Core-Earnings Weighted S&P 500” Index, which weights the largest 500 U.S. companies by Core Earnings instead of market cap, beat the S&P 500 by 27% over the past five years. Bloomberg’s official name for the index is Bloomberg New Constructs 500 Total Return Index (ticker: BNCVAT1T:IND). Figure 5 shows it was up 117% while the S&P 500 was up 89%.
Figure 5: Bloomberg New Constructs 500 Index Strongly Outperforms the S&P 500: Last Five Years
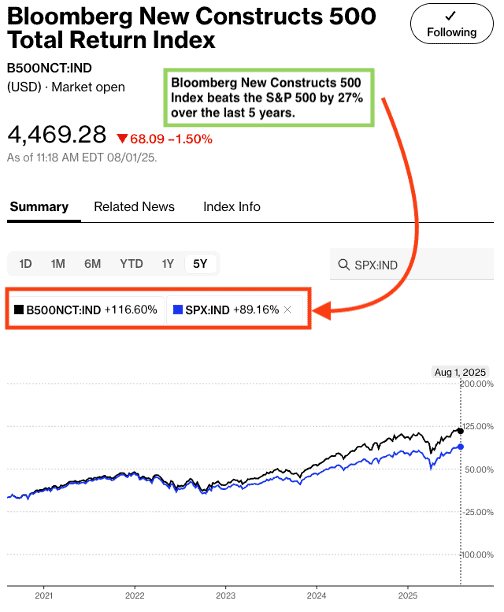
Sources: Bloomberg as of August 1, 2025
Note: Past performance is no guarantee of future results.
Please contact us at support@newconstructs.com if you have any questions.
This article was originally published on August 4, 2025.
Disclosure: David Trainer, Kyle Guske II, and Hakan Salt receive no compensation to write about any specific stock, sector, style, or theme.
Questions on this report or others? Join our online community and connect with us directly.