
The Bloomberg New Constructs Core Earnings Leaders Index (BCORET:IND) recently turned 1-year old and the performance in the first year of live-trading speaks for itself. The index beat the S&P 500 by a whopping 9% (up 26% compared to the S&P 500 up 18%). Beating the S&P 500 by such a large margin in such a bullish market is no small feat!
Curious as to what drives our novel alpha?
The answer is a superior measure of earnings, our proprietary Core Earnings. The Core Earnings Leaders Index holds the top 100 companies with high Earnings Capture[1], which equals Core Earnings minus GAAP earnings divided by total assets. In other words, this index allocates to the 100 companies whose Core Earnings exceed GAAP earnings by the most relative to the size of the company.
Core Earnings is a superior[2] earnings metric because we adjust it to remove unusual gains and losses found in the footnotes and MD&A in company filings. The outperformance of the Core Earnings Leaders Index is real-time proof of the alpha you can get from our proprietary Core Earnings.
Below, we share one of the stocks in the Core Earnings Leaders Index along with an overview of its Core Earning history and how understated they are.
Enjoy this free stock pick. Feel free to share it with friends and family.
Featured Stock from Bloomberg New Constructs Core Earnings Leaders Index: PayPal Holdings (PYPL)
Over the trailing-twelve months (TTM), PayPal’s (PYPL: $70/share) Core Earnings equal $5.0 billion while its GAAP earnings are lower, at $4.7 billion. The -$369 million in Earnings Distortion earns the company its place in the Core Earnings Leaders Index.
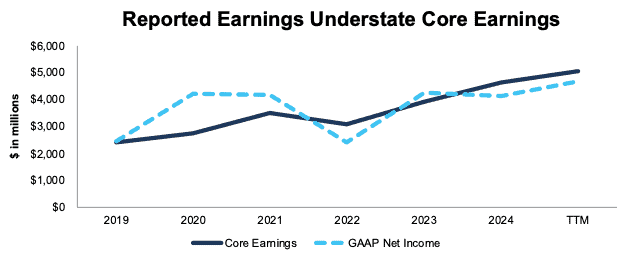
PayPal’s Core Earnings have increased 14% compounded annually since 2019 while reported earnings (GAAP Net Income) increased 12% compounded annually over the same time.
Figure 1 shows how PayPal’s Core Earnings rose from $2.4 billion in 2019 to $5.0 billion in the TTM ending 2Q25 while GAAP Net Income rose from $2.5 billion to $4.7 billion over the same time.
In the TTM ended 2Q25, PayPal’s Earnings Distortion of -$369 million, has flipped from $57 million in 2019. In other words, PayPal’s GAAP net income overstated Core Earnings in 2019, but in the TTM period (as well as 2024), the company is much more profitable than investors relying on GAAP net income realize.
Figure 1: PayPal’s Core Earnings vs. GAAP Net Income Since 2019
Sources: New Constructs, LLC and company filings
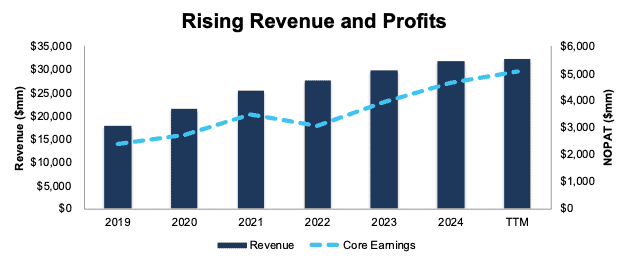
It should come as no surprise that PayPal has quality fundamentals, given its high and rising Core Earnings. The company has grown revenue and Core Earnings by 14% and 21% compounded annually, respectively, over the last decade.
More recently, PayPal’s net operating profit after-tax (NOPAT) margin improved from 14% in 2019 to 16% in the TTM while its invested capital turns rose from 1.5 to 1.8 over the same time. Rising NOPAT margin and invested capital turns drive the company’s return on invested capital (ROIC) from 21% in 2019 to 28% in the TTM.
Figure 2: PayPal’s Revenue and Core Earnings Since 2019
Sources: New Constructs, LLC and company filings
Real-Time Proof of Alpha Using a Superior Earnings Metric
As noted above, you don’t have to take our word for it when we say allocating capital based on Core Earnings and Earnings Capture drives novel alpha. The outperformance of the Bloomberg New Constructs Core Earnings Leaders Index demonstrates real-time alpha.
Per Figure 3, the Bloomberg New Constructs Core Earnings Leaders Index beat the S&P 500 by 44% over the past five years. The Index (ticker: BCORET:IND) was up 137% while the S&P 500 was up 92%. See Figure 7 for details.
Figure 3: Bloomberg New Constructs Core Earnings Leaders Index Outperforms the S&P 500
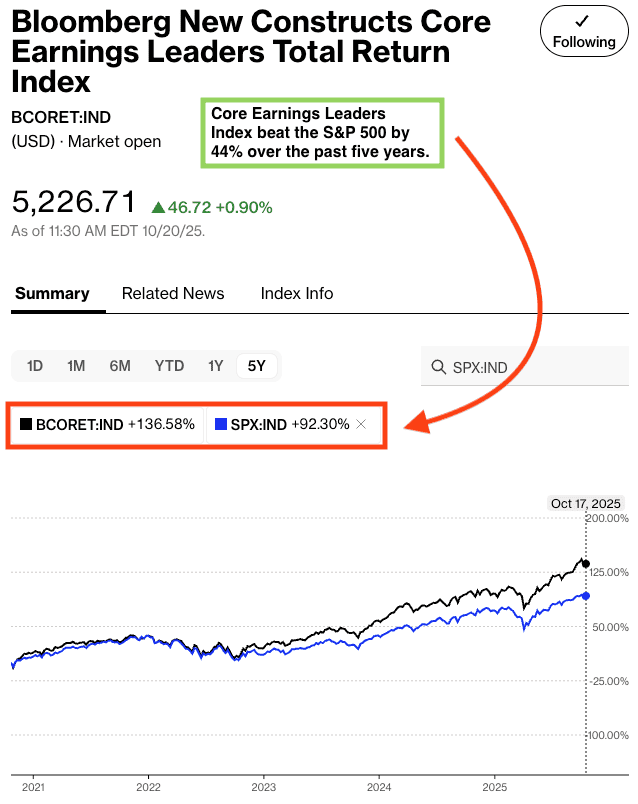
Sources: Bloomberg as of October 17, 2025
Note: Past performance is no guarantee of future results.
Wondering how the index has done more recently? See Figure 4 for details on the outperformance of the Bloomberg New Constructs Core Earnings Leaders Index year-to-date (YTD). BCORET:IND was up 24% while the S&P 500 was up 14%.
Figure 4: Bloomberg New Constructs Core Earnings Leaders Index Outperforms the S&P 500 YTD
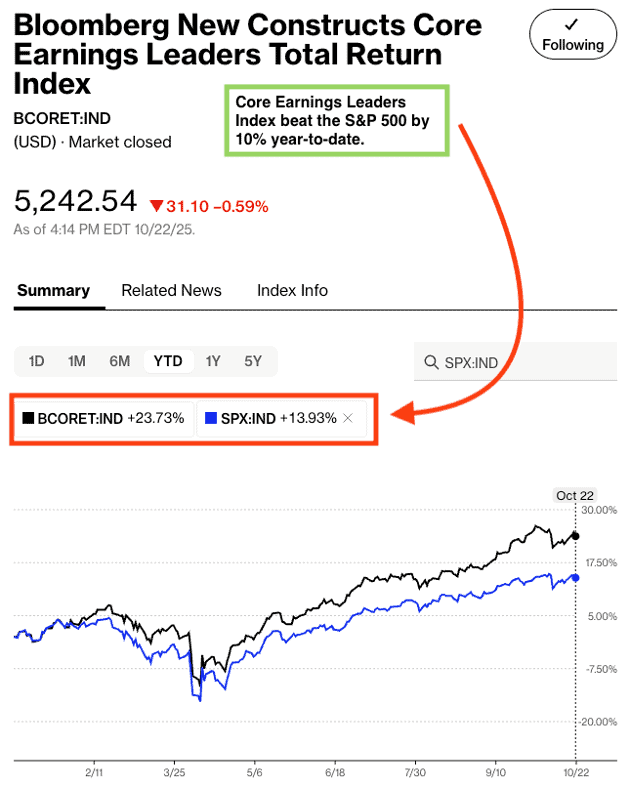
Sources: Bloomberg as of October 22, 2025
Note: Past performance is no guarantee of future results.
This article was originally published on October 23, 2025.
Disclosure: David Trainer, Kyle Guske II, and Hakan Salt receive no compensation to write about any specific stock, style, or theme.
Questions on this report or others? Join our online community and connect with us directly.
[1] Earnings Distortion equals GAAP earnings minus Core Earnings, or the opposite of Earnings Capture.
[2] This paper from Harvard Business School and MIT Sloan professors empirically proves the idiosyncratic alpha in Core Earnings.