
We’re happy to announce a big enhancement to our reverse discounted cash flow (DCF) models.
Below we provide a summary of the new updates.
Added Trailing-Twelve-Month Data to The Forecast Page
Clients can now leverage trailing-twelve-month (TTM) data when entering projections on the Forecast page.
Clients can view the TTM values for each of the drivers of our reverse DCF model:
- revenue growth,
- net operating profit before-tax (NOPBT) margin,
- cash tax rate,
- change in net working capital as a percent of revenue change, and
- change in fixed assets as a percent of revenue change.
We make it easy for clients to compare the TTM values with and forecasted values while building out their DCF scenarios.
TTM data appears as a new column, per Figure 1, on the Forecast page with annual data.
Figure 1: TTM Column Added to Forecast Page
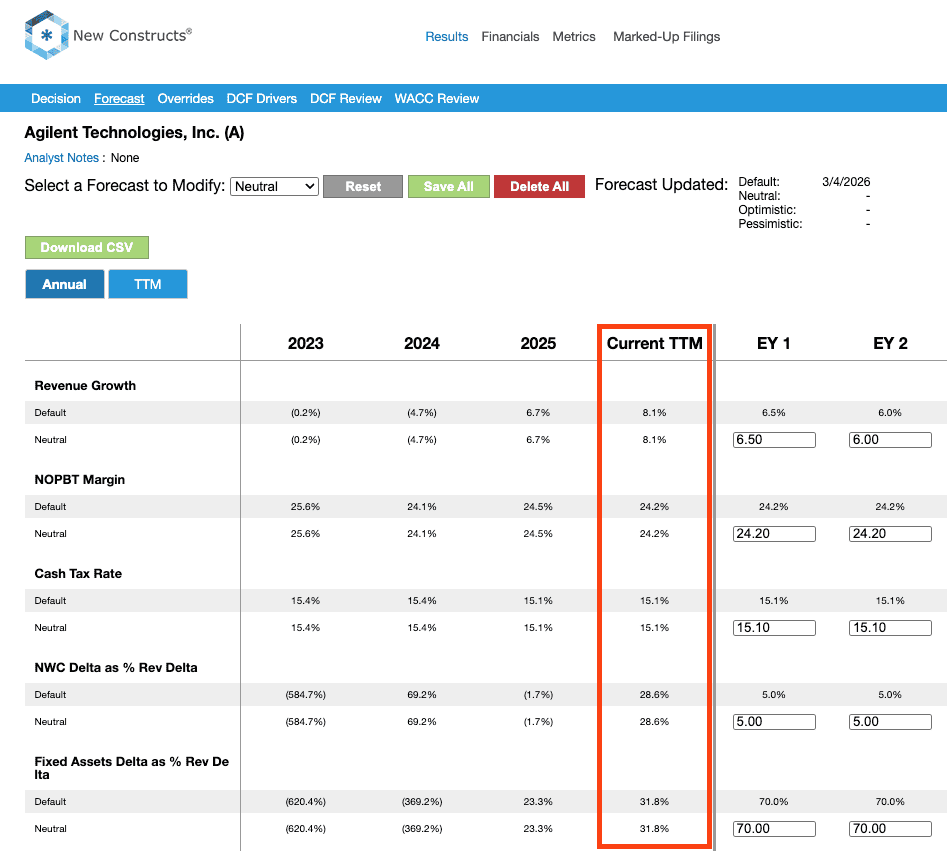
Sources: New Constructs, LLC
TTM data also appears on an entirely new TTM data tab on the Forecast page, per Figure 2. This tab allows users to view historical TTM values (i.e. TTM ended 3Q25, TTM ended 2Q25, TTM ended 1Q25, etc.) and future forecasted values for each of the drivers in our reverse DCF model.
Figure 2: Historical TTM Values Added to Forecast Page
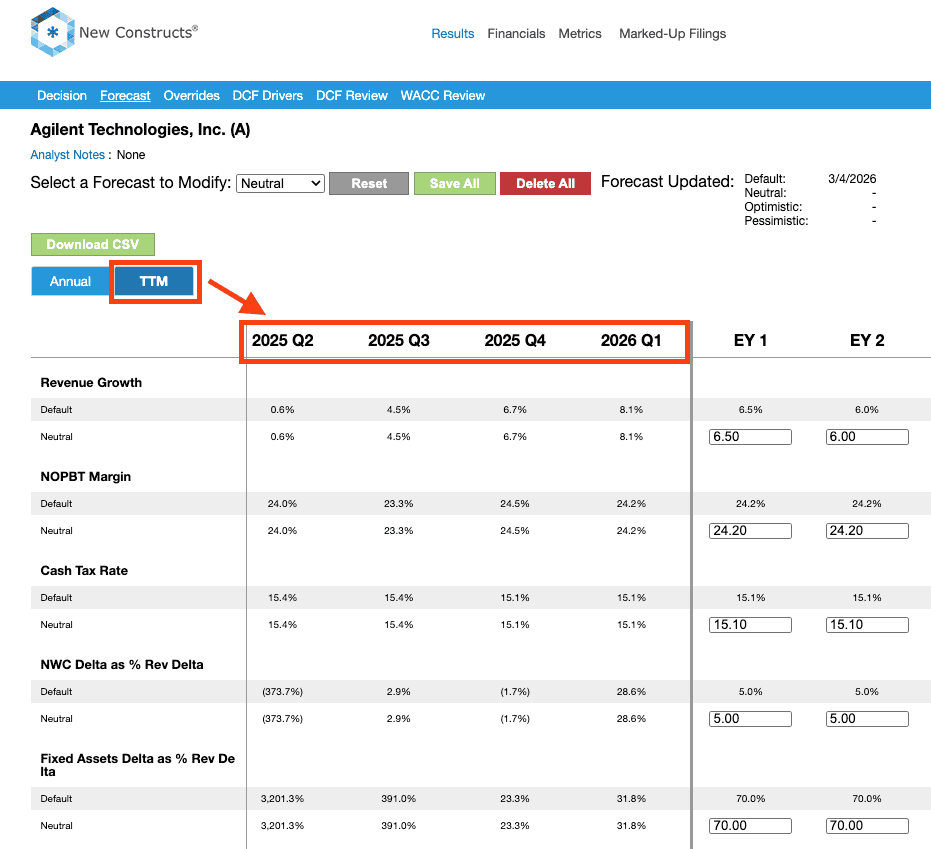
Sources: New Constructs, LLC
Want to see our reverse DCF model in action? Watch David Trainer quantify the future profit expectations baked into Micron (MU) in our recent People’s Choice Earnings Watch Party here.
See all the features and tools in our Institutional membership here.
Please contact us at support@newconstructs.com if you have any questions.
This article was originally published on March 27, 2026.
Disclosure: David Trainer and Kyle Guske II receive no compensation to write about any specific stock, sector, style, or theme.
Questions on this report or others? Join our online community and connect with us directly.