Note to non-subscribers: We are no longer offering all of our reports for free. You may have noticed that many of the top experts in the financial sector value our reports quite highly. Barron’s has featured our best-in-market research seven times this year already as have USA Today, CNBC, MarketWatch.com, The Motley Fool, The Wall Street Journal, Abnormal Returns, Fox Business and the list goes on.
We are offering this report for free to start off the 3Q14 Best and Worst ETFs and Mutual Funds series. However, most of our reports, which include detailed analysis of all 10 sectors and 12 fund styles, will be available to subscribers only. We will be updating all the sector reports and all the style reports from last quarter. For a limited time, you can get access to all our reports for just $9.99/month.
This report focuses on my top picks and pans for all sector funds. I will follow this summary with a detailed report on each sector.
My top ETFs and mutual funds have high-quality holdings and low costs. As detailed in “Low-cost funds dupe investors”, there are few funds that have both good holdings and low costs. While there are lots of cheap funds, there are very few with high-quality holdings.
I think there are at least two causes for this disconnect. First, there is, in general, a lack of independent research on ETFs and funds. Second, I think it is fair to say that there is a severe lack of quality research into the holdings of mutual funds and ETFs. There should not be such a large gap between the quality of research on stocks compared to that for funds.
After all, investors should care more about the quality of a fund’s holdings than its costs because the quality of a fund’s holdings is the single most important factor in determining its future performance.
My predictive rating system rates 7200+ ETFs and mutual funds according to the quality of their holdings (Portfolio Management Rating), their costs (Total Annual Costs Rating), and the fund’s rank relative to every other ETF and mutual fund.
Figure 1 shows the best ETF or mutual fund in each sector as of July 8, 2014.
For a full list of all ETFs and mutual funds for each sector ranked from best to worst, see our ETF & mutual fund screener.
Figure 1: Best ETF or Mutual Fund In Each Sector
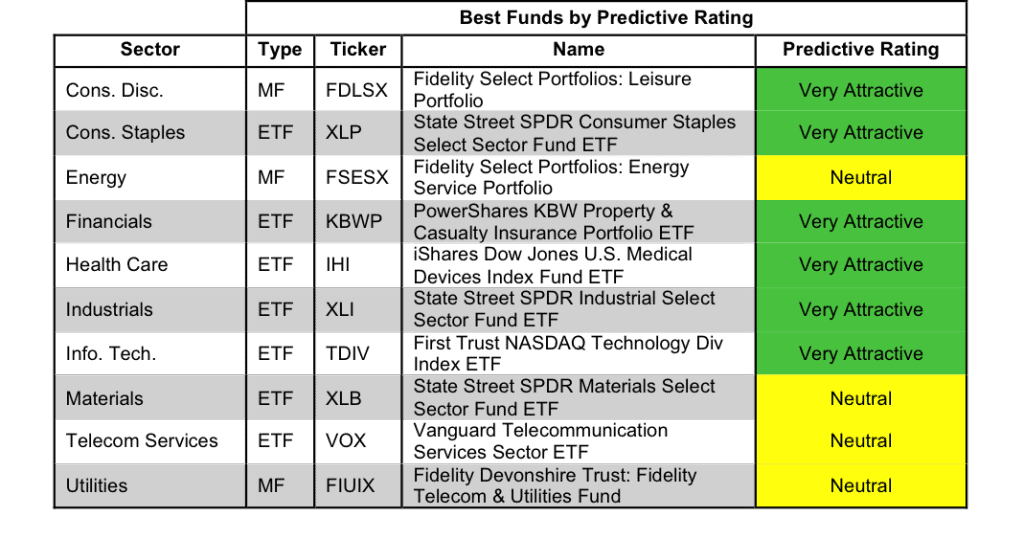
Source: New Constructs, LLC and company filings
PowerShares KBW Property & Casualty Insurance Portfolio ETF (KBWP) is my overall highest rated ETF and earns my Very Attractive rating. KBWP allocates over 90% of its assets to Attractive-or-bettter rated stocks, all while charging investors low total annual costs of 0.40%.
The Chubb Corp (CB) is one of my favorite stocks held by KBWP and earns my Very Attractive rating. It also makes the Most Attractive Stocks list for July. Over the past decade CB has grown after-tax profit (NOPAT) by 13% compounded annually and CB’s return on invested capital (ROIC) of 16% is in the top quintile of all companies I cover. CB has also generated posistive economic earnings for 10 consecutive years. The best part about CB is that despite its stock price increasing over 12% since February, the company is still undervalued. At its current price of ~$93/share, CB has a price to economic book value ratio (PEBV) of 0.7. This ratio implies the market expects a permanent 30% decline in CB’s NOPAT. This expectation seems pessimistic considering CB’s strong history of growing NOPAT. At its current price CB presents an excellent opportunity for investors.
Figure 2 shows the worst ETF or mutual fund for each sector as of July 8, 2014.
Dangerous-or-worse-rated funds have a combination of low-quality portfolios (i.e. they hold too many Dangerous-or-worse rated stocks) and high costs (they charge investors too much for the [lack of] management they provide).
Figure 2: Worst ETF or Mutual Fund In Each Sector
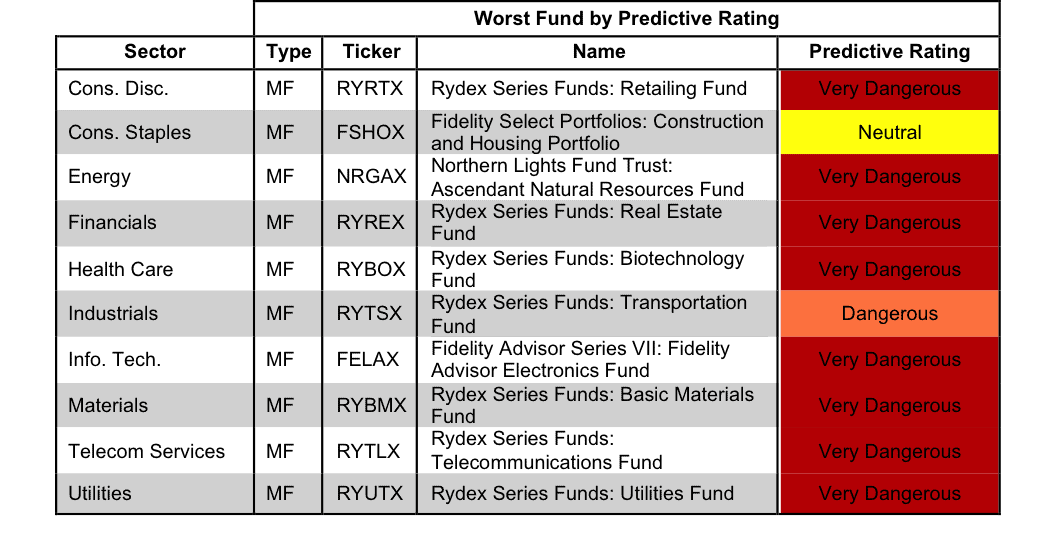
Source: New Constructs, LLC and company filings
Rydex Series Funds: Retailing Fund (RYRTX) is my overall worst-rated mutual fund and earns my Very Dangerous rating. RYRTX allocates 67% of its assets to neutral-or-worse rated stocks, and charges investors high total annual costs of 5.07%.
Take note that seven of the ten funds in Figure 2 are Rydex Series funds.
Walgreen Company (WAG) is one of my least favorite stocks held by RYRTX and earns my Dangerous rating. WAG has grown NOPAT by only 3% compounded annually since 2008. During this time period, WAG’s ROIC has steadily declined from 9% to just 6%. Despite the company’s sluggish profit growth, WAG’s stock price has increased over 20% this year to $71/share. To justify this share price, WAG would need to grow NOPAT by 10% compounded annually for the next 12 years. This level of NOPAT growth seems unlikely for a company that has not grown profits at all since 2011. Investors should avoid WAG.
Traditional mutual fund research has focused on past performance and low management costs. The quality of a fund’s holdings has been ignored. Our Portfolio Management Ratingexamines a fund’s holdings in detail and takes into account the fund’s allocation to cash. Our models are created with data from over 50,000 annual reports. This kind of due diligence is necessary for understanding just what you are buying when you invest in a mutual fund or an ETF.
Figure 3 shows the best ETF or mutual fund based on our Portfolio Management Rating for each sector as of July 8, 2014.
Attractive-or-better-rated funds own high-quality stocks and hold very little of the fund’s assets in cash – investors looking to hold cash can do so themselves without paying management fees. Only 12% of funds receive our Attractive or Very Attractive Portfolio Management ratings, so investors need to be cautious when selecting a sector mutual fund or ETF. There are thousands of that funds earn my Neutral-or-worse-rating.
Figure 3: ETF or Mutual Fund With Highest Quality Holdings by Sector
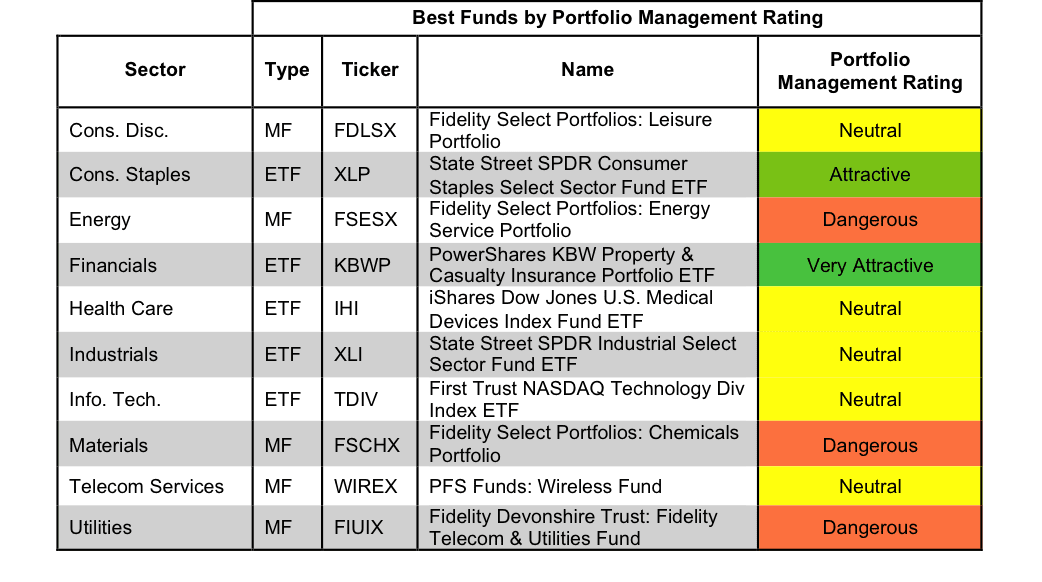
Source: New Constructs, LLC and company filings
Figure 4 shows the worst ETF or mutual fund based on our Portfolio Management Rating for each sector as of July 8, 2014.
Many ETFs and mutual funds managers do a poor job identifying quality stocks. These funds are not worth owning at any cost.
Figure 4: ETF or Mutual Fund With Lowest Quality Holdings by Sector
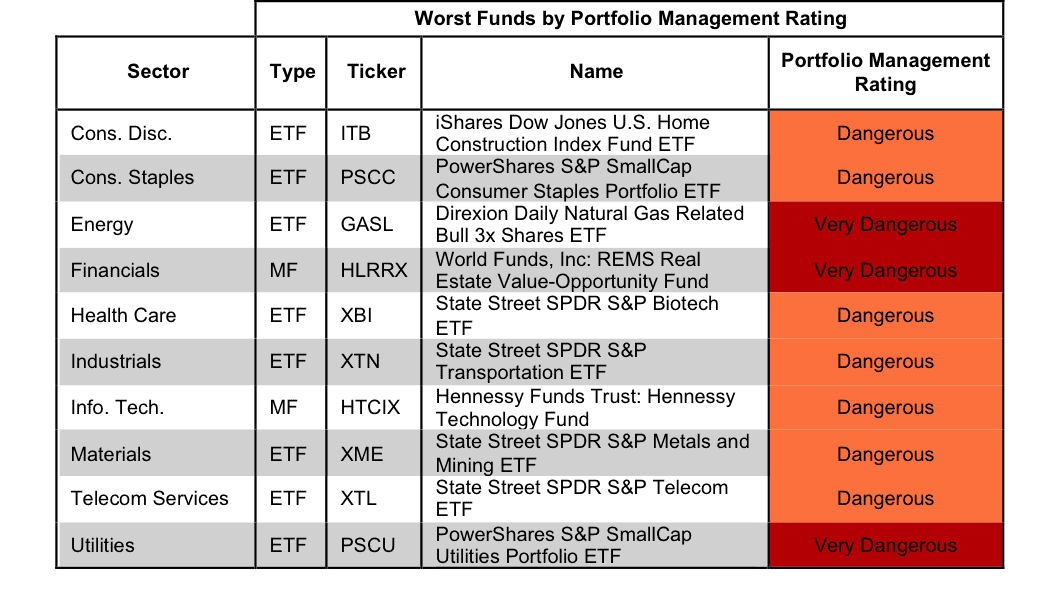
Source: New Constructs, LLC and company filings
Investors should care about all of the fees associated with a fund in addition to the quality of the fund’s holdings. The best ETFs and mutual funds have both low costs and quality holdings — and there are plenty of low-cost funds available to investors.Source: New Constructs, LLC and company filings
Figure 5 shows the best ETF or mutual fund in each sector according to our Total Annual Costs Rating.
Total Annual Costs incorporates all expenses, loads, fees, and transaction costs into a single value that is comparable across all ETFs and mutual funds. Passively managed ETFs and index mutual funds are generally the cheapest.
Figure 5: ETF or Mutual Fund With Lowest Costs by Sector
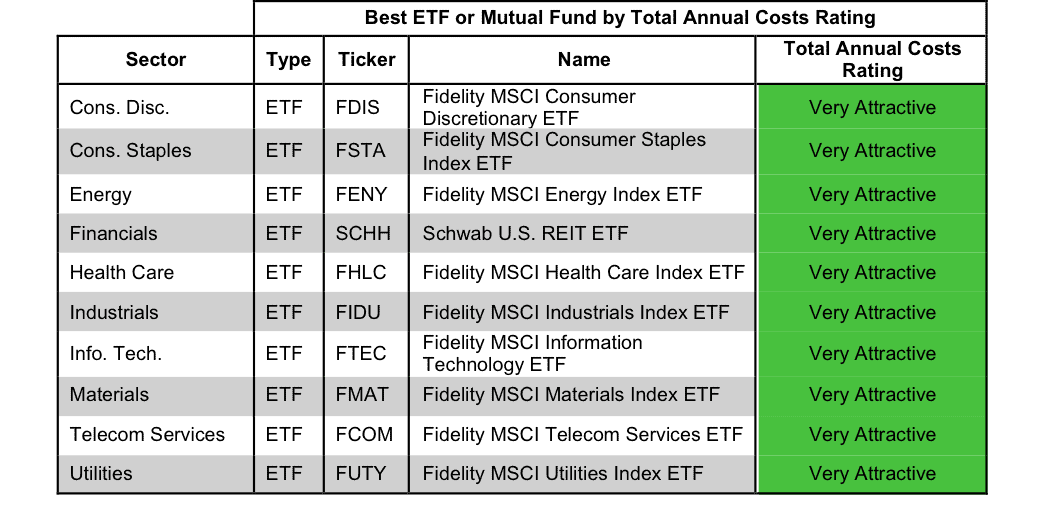
Source: New Constructs, LLC and company filings
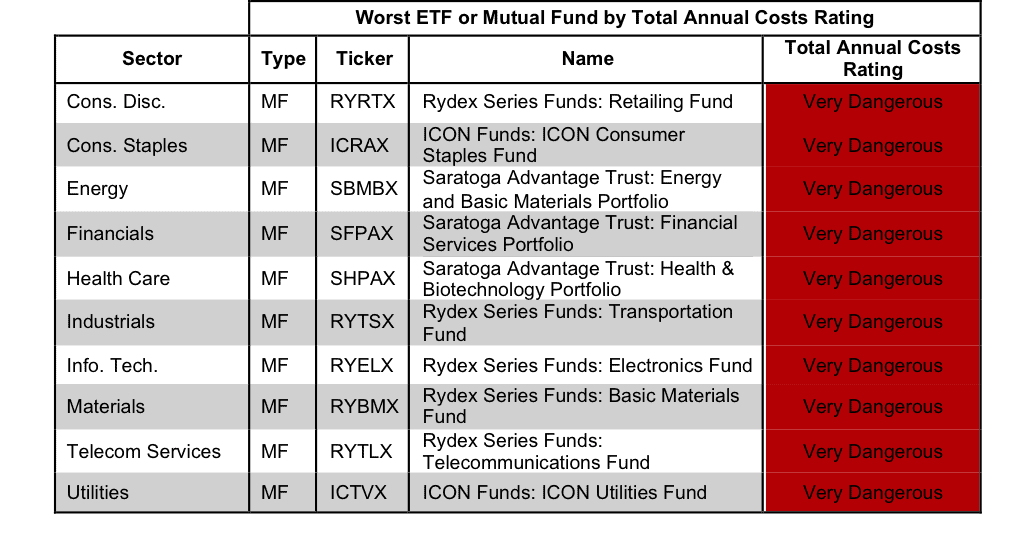
Figure 6 shows the worst fund in each sector according to our Total Annual Costs Rating.
The most expensive fund for each sector has a Very Dangerous Total Annual Costs Rating. Investors should avoid these funds and other funds with Very Dangerous Total Annual Costs Ratings because they charge investors too much. For every fund with a Very Dangerous Total Annual Costs Rating there is an alternative fund that offers similar exposure and holdings at a lower cost. We cover over 6800 mutual funds and over 400 ETFs. Investors have plenty of alternatives to these overpriced funds.
Figure 6: ETF or Mutual Fund With Highest Costs by Sector
Source: New Constructs, LLC and company filings
Kyle Guske II contributed to this report.
Disclosure: David Trainer owns CB. David Trainer and Kyle Guske II receive no compensation to write about any specific stock, sector or theme.