
Dividend stocks are not the safe-haven that investors think. Anyone thinking that dividend stocks are a good strategy to succeed in these turbulent markets needs to think twice and read on.
We recently hosted a live training session warning investors about the dangers of fake dividend stocks. Fake Dividend Stocks might pay a nice dividend, but the risk of significant decline in stock price more than offsets any potential gains investors might expect from the dividend. In other words, if a stock pays a 5% dividend but drops 20%, then investors lose a lot of money on that stock despite the 5% dividend.
In this report, we’re here to warn you of another type of bad dividend stock:
False Dividend Stocks
False Dividend Stocks pay a dividend, but the company doesn’t generate enough cash flow to afford the dividend. Therefore, the high risk of seeing the dividend cut along with the likely drop in the stock price due to the dividend cut more than offsets the potential gains investors might expect from a False Dividend Stock.
Successful dividend investing is not about finding companies that pay dividends. It’s about finding companies that can afford to keep paying and, hopefully, grow their dividend. A dividend is only good if the company generates the cash flows to afford it.
You don’t want your “income stock” to stop paying dividends because the company can’t afford it. Investors need to know if past dividends have been funded by taking on more debt or spending down cash balances.
The only way to avoid False Dividend Stocks is with diligent fundamental research on cash flows. As we’ve proven many times, investors must do their homework to get the truth about cash flow.
Below, we break down just how prevalent False Dividend Stocks are in the current market.
Pinpointing the False Dividend Risk
To find False Dividend Stocks, we first screen our entire coverage universe for stocks that pay a dividend. Of course, if a stock does not pay a dividend, it cannot be a False Dividend Stock.
Of the ~3,300 stocks under coverage, 1,416 stocks, or 43%, pay a dividend. Only 44 stocks, or 1% of the universe qualify as Good Dividend Stocks because they earn a spot in one of our dividend model portfolios: Safest Dividend Yield Stocks and Dividend Growth Stocks.
Figure 1: Dividend Paying Stocks in Coverage Universe – As of June 4, 2025
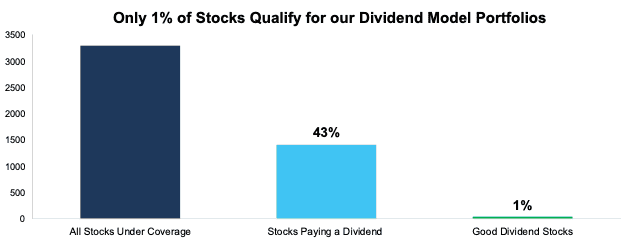
Sources: New Constructs, LLC and company filings
After we’ve identified the dividend stock paying universe, we then parse out the False Dividend Stocks, i.e. companies with negative free cash flow (FCF) in the trailing-twelve-month (TTM) period.
Per Figure 2, there are 344 dividend-paying stocks with negative FCF in the TTM period as of June 4, 2025.
Figure 2: Dividend Stocks with Negative TTM FCF – As of June 4, 2025

Sources: New Constructs, LLC and company filings
The False Dividend Stocks
Below, we reveal three of the 344 riskiest False Dividend Stocks. These stocks earn our worst rating, Very Unattractive. Not only are the dividends false, but the stocks are also very expensive and overvalued.
Worse yet, there’s higher risk that these three companies will have to cut their dividend because their dividend payments exceed cash flows not just in the TTM but over the past five years. In other words, these companies have been burning cash to pay dividends for an extended period.
These companies are digging themselves quite a hole here. See the last column in Figure 3, the Dividend Deficit as a % of TTM Revenue. This shows how much dividend payments have exceed cash flows over the past five years as a percent of revenue. This metric shows how high the risk that these companies will have to cut their dividend is because they do not have the revenues, much less the income, to fund dividends.
Figure 3: Three Very Unattractive Rated False Dividend Stocks
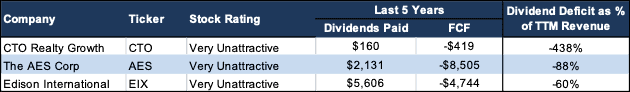
Sources: New Constructs, LLC and company filings
CTO Realty Growth (CTO: $18/share): 8.3% Dividend Yield
CTO Realty Growth earns its spot on the False Dividend Stocks list with -$189 million in FCF over the TTM period. CTO Realty Growth’s Dividend Deficit (FCF minus Dividends) as a % of TTM Revenue is -438% as dividends paid ($160 million) exceeded FCF (-$419 million) by $579 million over the last 5 years. From 2020-1Q25, CTO Realty Growth’s cumulative Dividend Deficit is -$661 million. See Figure 4.
Figure 4: CTO Realty Growth’s Dividend Deficit: FCF Minus Dividends: 2020-1Q25
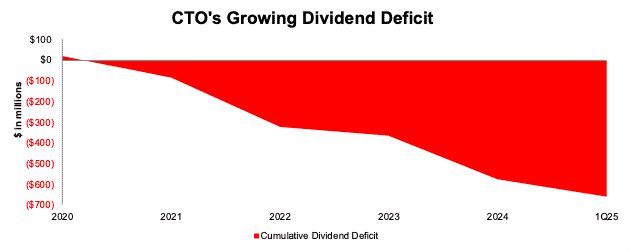
Sources: New Constructs, LLC and company filings
The shareholder dilution required to fund this huge dividend deficit should make management blush.
Specifically, CTO Realty Growth’s total debt increased 116% from $273 million in 2020 to $603 million in the TTM ended 1Q25. The company’s shares outstanding increased 86% from 17.7 million to 32.9 million over the same time.
Making matters worse, CTO Realty Growth earns a low return on invested capital (ROIC) of just 1% and has a 2 yr avg free cash flow (FCF) yield of -10%. CTO’s price-to-economic book value (PEBV) ratio is -1.4 due to its negative economic book value, or no growth value, of -$13/share. Furthermore, in the default scenario of our reverse discounted cash flow (DCF) model, CTO has a market-implied Growth Appreciation Period (GAP) of greater than 100 years. Poor fundamentals and an expensive stock price earn CTO a Very Unattractive Stock Rating.
The AES Corp (AES: $10/share): 6.9% Dividend Yield
The AES Corp is also a False Dividend Stock due to its negative $719 million in FCF over the TTM. AES Corp’s Dividend Deficit as a % of TTM Revenue is -88% as dividends paid ($2.1 billion) exceeded FCF (-$8.5 billion) by $10.6 billion over the last 5 years. From 2020-1Q25, AES Corp’s cumulative Dividend Deficit is -$11.5 billion. See Figure 5.
Figure 5: AES Corp’s Dividend Deficit: FCF Minus Dividends: 2020-1Q25
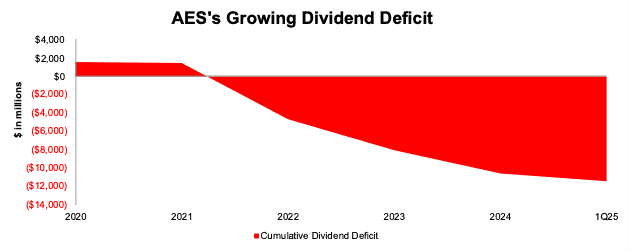
Sources: New Constructs, LLC and company filings
Similar to CTO Realty Growth, the shareholder dilution required to fund this huge dividend deficit is scary. The AES Corp’s total debt increased 57% from $20.3 billion in 2020 to $31.9 billion in the TTM ended 1Q25. The company’s shares outstanding increased 7% from 665.4 million to 711.9 million over the same time.
The AES Corp also generates a ROIC of 2% and a 2-yr Avg FCF yield of -4%. The AES Corp’s PEBV ratio is -0.7 with an economic book value of -$14/share. Furthermore, in the default scenario of our reverse DCF model, AES has a market-implied GAP greater than 100 years. Poor fundamentals and an expensive stock price earn AES a Very Unattractive Stock Rating.
Edison International (EIX: $56/share): 5.9% Dividend Yield
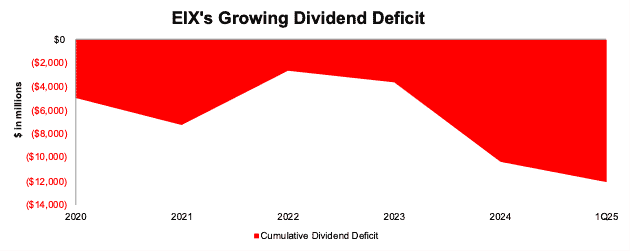
Edison International burned $1.1 billion in FCF over the TTM, and the cash burn is even worse over the past five years. Edison International’s Dividend Deficit as a % of TTM Revenue is -60% as dividends paid ($5.6 billion) exceeded FCF (-$4.7 billion) by $10.4 billion over the last 5 years. From 2020-1Q25, Edison International’s cumulative Dividend Deficit is -$12.1 billion. See Figure 6.
Figure 6: Edison International’s Dividend Deficit: FCF Minus Dividends: 2020-1Q25
Sources: New Constructs, LLC and company filings
As with the two stocks above, investors should note the shareholder dilution required to fund this huge dividend deficit. Total debt increased 35% from $37.3 billion in 2020 to $50.4 billion in the TTM ended 1Q25. The company’s shares outstanding increased 2% from 378.9 million to 384.8 million over the same time.
Edison International’s earns a bottom quintile ROIC of just 3% while its 2 yr avg FCF Yield sits at -4%. Edison International’s PEBV ratio is 3.5, with an economic book value of just $15/share. In the default scenario of our reverse DCF model, EIX has a market-implied GAP of 5 years, which indicates the stock may not be as overvalued as the two above. However, the company’s poor fundamentals and high PEBV ratio still earn EIX a Very Unattractive Stock Rating.
Upcoming Dividend Training Sessions
After years of digging into Wall Street’s accounting tricks, we know firsthand that many so-called “dividend plays” are traps for Main Street investors.
To help investors of any kind avoid these pitfalls, we recently hosted a training showing you exactly how to spot a False Dividend Stock. Watch the replay here.
As a follow-up, we hosted another training discussing the exact topic of this report: Dividend-trap Stocks. You can watch the replay here.
No matter how good the dividend, investing in a bad stock can cost you much more than the dividend pays.
Want to know where to get good dividend stocks? We hosted a separate live training on June 17at 1pm ET. In this training, we not only cover the dangers of dividends, but also show you which dividend stocks are worth owning. Watch the replay here.
This article was originally published on June 9, 2025.
Disclosure: David Trainer, Kyle Guske II, and Hakan Salt receive no compensation to write about any specific stock, style, or theme.
Questions on this report or others? Join our online community and connect with us directly.