The Small Cap Value style ranks last out of the twelve fund styles as detailed in our 4Q16 Style Ratings for ETFs and Mutual Funds report. Last quarter, the Small Cap Value style ranked last as well. It gets our Dangerous rating, which is based on an aggregation of ratings of 19 ETFs and 264 mutual funds in the Small Cap Value style as of November 9, 2016. See a recap of our 3Q16 Style Ratings here.
Figures 1 and 2 show the five best and worst rated ETFs and mutual funds in the style. Not all Small Cap Value style ETFs and mutual funds are created the same. The number of holdings varies widely (from 29 to 1482). This variation creates drastically different investment implications and, therefore, ratings.
Investors seeking exposure to the Small Cap Value style should buy one of the Attractive-or-better rated ETFs or mutual funds from Figures 1 and 2.
Figure 1: ETFs with the Best & Worst Ratings – Top 5
 * Best ETFs exclude ETFs with TNAs less than $100 million for inadequate liquidity.
Sources: New Constructs, LLC and company filings
First Trust Dow Jones Select Micro Cap Index Fund (FDM) and First Trust Mid Cap Value AlphaDEX Fund (FNK) are excluded from Figure 1 because their total net assets (TNA) are below $100 million and do not meet our liquidity minimums.
Figure 2: Mutual Funds with the Best & Worst Ratings – Top 5
 * Best mutual funds exclude funds with TNAs less than $100 million for inadequate liquidity.
Sources: New Constructs, LLC and company filings
Vanguard Small-Cap Value Index Fund (VBR) is the top-rated Small Cap Value ETF and Royce Special Equity Fund (RYSEX) is the top-rated Small Cap Value mutual fund. VBR earns a Neutral rating and RYSEX earns a Very Attractive rating.
Guggenheim S&P MidCap 400 Pure Value ETF (RFV) is the worst rated Small Cap Value ETF and ProFunds Mid-Cap Value (MLPSX) is the worst rated Small Cap Value mutual fund. RFV earns a Dangerous rating and MLPSX earns a Very Dangerous rating.
PC Connection (CNXN: $23/share) is one of our favorite stocks held by RVFIX and earns an Attractive rating. Over the past decade PC Connection has grown after-tax profit (NOPAT) by 22% compounded annually. The company has improved its return on invested capital (ROIC) from 3% in 2005 to 11% over the last twelve months (TTM). Despite the improving fundamentals, CNXN remains undervalued. At its current price of $23/share, CNXN has a price-to-economic book value (PEBV) ratio of 0.9. This ratio means the market expects CNXN’s NOPAT to permanently decline by 10%. If CNXN can grow NOPAT by 7% compounded annually for the next decade, the stock is worth $30/share today – a 30% upside.
Steel Dynamics (STLD: $27/share) is one of our least favorite stocks held by MLPSX and earns a Dangerous rating. Over the past five years, STLD’s NOPAT has declined 12% compounded annually. The company’s ROIC has fallen 16% in 2005 to 6% TTM. Making matters worse, STLD has not generated positive economic earnings since 2008. Despite the clear deterioration of fundamentals, STLD remains overvalued. To justify its current price of $27/share, STLD must grow NOPAT by 14% compounded annually for the next decade. These expectations seem overly optimistic given the operational struggles and profit decline of late.
Figures 3 and 4 show the rating landscape of all Small Cap Value ETFs and mutual funds.
Figure 3: Separating the Best ETFs From the Worst Funds
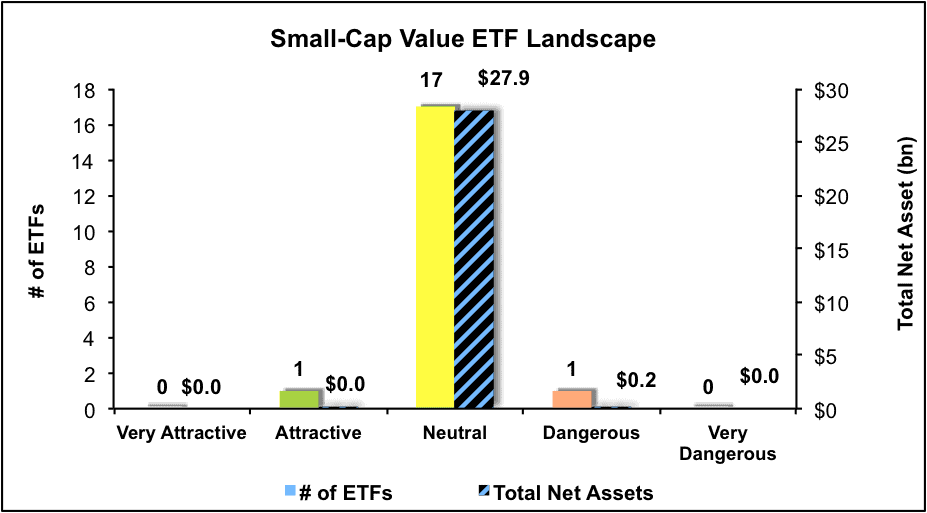
Sources: New Constructs, LLC and company filings
Figure 4: Separating the Best Mutual Funds From the Worst Funds
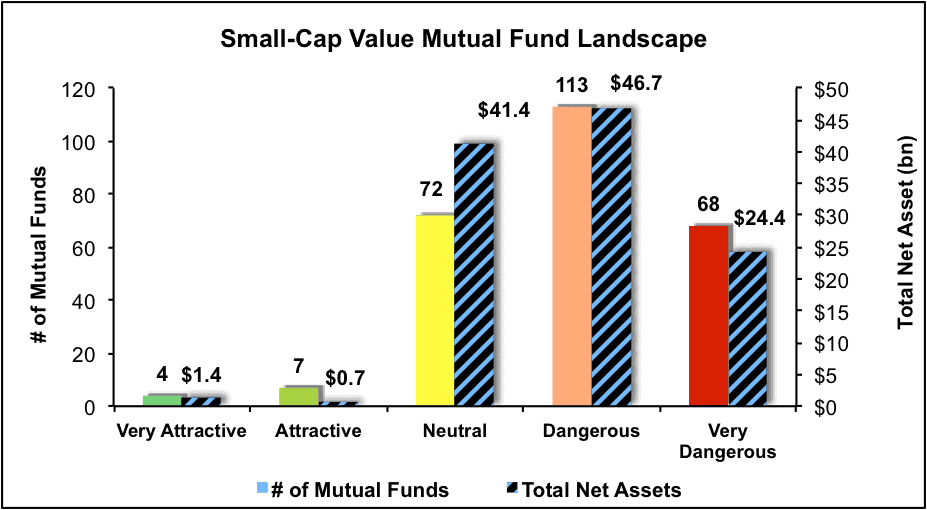
Sources: New Constructs, LLC and company filings
This article originally published here on November 9, 2016.
Disclosure: David Trainer, Kyle Guske and Kyle Martone receive no compensation to write about any specific stock, style, or theme.