
In a recent meeting with clients, we used our reverse DCF model to quantify the future revenue and cash flow expectations in Spotify (SPOT) at $622 per share. The results astounded us, and we think they will astound you.
The point of this report is to show you how to identify a stock that has likely seen its best days; so you can avoid losing money and start looking for stocks that will make you money.
First, let me show you how much downside risk is in a stock as hyped up as Spotify.
Expectations Investing Analysis on SPOT
As we do for all of our Reverse DCF Case Studies, we use our valuation models to quantify the future performance of the company required to justify the stock price.
Specifically, our model shows that to justify ~$622/share Spotify has to:
- grow revenue by 27.5% compounded annually for 15 years while also
- improving its return on invested capital (ROIC) from 344% to 2,412%.
Let’s put some context around those expectations.
Benchmarking Expectations for SPOT
First, growing revenue at a 28% CAGR for 15 years means Spotify revenue would be $562 billion in 2039, which is greater than Apple’s trailing twelve months[1] (TTM) revenue. $560 billion in revenue is lower than only Amazon’s (AMZN) TTM revenue at $620 billion (#2 in the S&P 500) and Walmart’s (WMT) TTM revenue at $674 billion (#1 in the S&P 500). See Figure 1 for details.
Figure 1: Comparing Spotify’s Revenue and ROIC to top Companies in the S&P 500
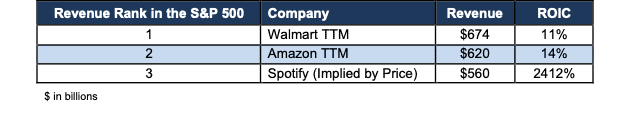
Sources: New Constructs, LLC and company filings.
It is important to note that the stock price embeds expectations for revenue reaching $560 billion while Spotify – also – increases its to 2,412%.
For reference, the highest ROIC in the S&P 500 is ~450%. No S&P 500 company has achieved an ROIC higher than 600% in the last 5 years. Yet, Mr. Market is projecting that Spotify will increase its ROIC to 2412%. Seems like a high expectation for any business.
Absurd Market Share Implications for SPOT at $622/share
Based on global data and business intelligence firm, Statista, the worldwide market for “Music, Radio & Podcasts” will be $124.8 billion in 2025. Statista expects the market to grow at a 3.23% CAGR through 2029 and reach $141.7 billion. If we assume the worldwide market grows at 3.23% until 2039, it would reach $195 billion, or just 35% of $560 billion, the 2039 revenue for Spotify implied by its current stock price. In other words, Spotify’s stock price at $622/share implies it will own 287% of the worldwide market for “Music, Radio & Podcasts” in 2030. See Figure 2.
Figure 2: Spotify’s Market Share Must Grow from 15% to 287% to Justify $622/share.
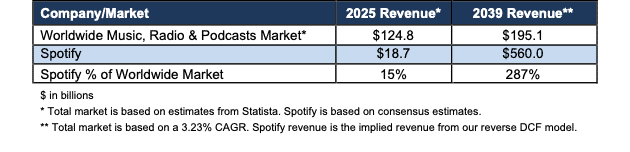
Sources: New Constructs, LLC and company filings.
As, we discuss in our latest reverse DCF case study video, we think there are several reasons why the expectations embedded in Spotify’s current stock price are too high.
Competitive Realities
Large revenue growth, like what’s embedded in Spotify’s stock price, implies quite significant market share gains per Figure 2. We note that market share gains are typically won with lower prices, which are not possible with a company that must also increase its ROIC to very high levels.
In other words, Spotify’s stock price is implying a doubly-incredible future where the company achieves huge revenue growth and ROIC increases as well.
Where to Find Good Stocks
We’re not here just to warn you about the bad stocks, we’re here to help you find good ones, too. We provide our proven-superior ratings on over 3,300 stocks. Unlike Wall Street, where 95% of the stocks get a Buy or Hold Rating, less than 15% of our stocks get an Attractive or Very Attractive Rating. We work hard to provide the best fundamental research in the world. We’re constantly providing free training and stock picks to help investors make more money and invest with peace of mind.
See Figure 3 for a peek at what our Stock Ratings look like. We blocked out the ticker here, but trust that we have plenty of Attractive and Very Attractive stocks, ETFs and mutual funds in our coverage universe of 10,000+ securities.
Figure 3: How To Find The Right Stocks: The Robo-Analyst Rating System
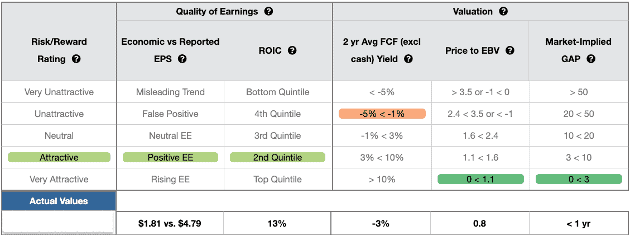
Sources: New Constructs, LLC and company filings.
We think the MOMO, YOLO, SPAC, NFT, meme stock and meme coin trading ploys are bad for investors, bad for our stock market, and bad for our country. We’re here to give you proven-superior investment research that is good for the long-term health of your portfolio and your peace of mind.
How To Avoid the Landmines
Whenever stocks get super expensive, it is only a matter of time before they fall back to earth as the law of competition inevitably proves the expectations for future cash flows to be overly optimistic.
We have multiple Model Portfolios, including our Zombie Stocks list, to warn investors of stocks to avoid and alert them to stocks that get our Attractive rating. We also provide best-in-class ratings for stocks, ETFs, and mutual funds.
We hope you enjoy this research. Feel free to share with friends and colleagues!
More Expectations Investing Case Studies
Too few investors have the tools to unveil the details behind stock valuations. We make it clear and easy. Math is math. Valuation is not supposed to be hard. Wall Street wants to keep you in the dark by making you think it is too hard to get the truth about valuation.
We shed light into the dark corners of the market and make them into opportunities to win not get lose money.
If you enjoyed seeing what we show for Spotify’s real cash flows as well as the future revenue expectations baked into the stock price, you’ll love our other reverse DCF case studies.
If you’re interested in seeing more examples of how our DCF model works, I recommend checking out the Reverse DCF Case Studies here in our Online Community. It is free to join, just complete this form.
This article was originally published on February 26, 2025.
Disclosure: David Trainer, Kyle Guske II, and Hakan Salt receive no compensation to write about any specific stock, sector, style, or theme.
Questions on this report or others? Join our online community and connect with us directly.
[1] TTM values are as of as of February 3rd, 2025 when we pulled the report from our database.